Primary and Secondary Performance Metrics
If you are building a classifier then you must measure it’s classification performance. If you are building a robot to pick up an object, you have to measure its ability to pick up objects. Any AI technology that cannot be measured on one or more primary performance metrics cannot be evaluated against competing technologies. Secondary performance metrics are about efficiency. Efficiency in space, weight and power and even efficiency in a users ability to learn to use the technology. As the old saying goes: First solve the problem and only then make it efficient.
Primary Metrics for Classification: Precision, Recall, Accuracy and F1
Before we take a look at some specific classifier benchmark examples and compare our classifier to other classifiers, we need to cover exactly how a classifier’s primary metrics performance is measured. Let’s suppose that we have some binary classification task such as the breast cancer ‘benign’ or ‘malignant’ benchmark and we force the classifier to make a choice. For every pattern, we can only be correct (true positive or TP) or incorrect (false positive or FP). It is then pretty easy to come up with a metric on how well you do on the task. Just take how many times it was correct and divide that by the total number of trials (TP+FP). We call this the precision:

This is pretty straightforward. But what happens if we have more than two labels? What happens if we do not force the classifier to output a label and we allow a ‘no answer” output? Yikes! To resolve these cases we must generalize our measurements. We first identify four conditions:
| Condition | Explanation |
|---|---|
| True-Positive | Label was given and its correct |
| False-Positive | Label was given and its incorrect |
| True-Negative | Label was not given and its correct |
| False-Negative | Label was not given and its incorrect |
Classification Primary Metrics
With this we can define a few measurements:
| Measurement | Formula |
|---|---|
| Precision |  |
| Recall or Sensitivity |  |
| Accuracy |  |
| F1 |  |
There are more ways of measuring the performance of a classifier than those above, and if you are interested Wikipedia has a lot to say about it. For now we just have to give you a sense of what each of these measurements tells us. Suppose we were trying to learn some multi-label classification problem that has a few labels. One of the labels only ever occurred some tiny portion of the time, for example .1%. Notice that in this case, the correct answer is “no answer”, and if a classifier just dumbly returns no-answer it would be right 99.9% of the time! 99.9% sounds really good, but in this case its about as dumb as you can get. To deal with this problem we can disregard true-negatives or false-negatives altogether. This is the idea behind the precision metric. However, there is no one metric because we could even cheat again. What if we only took outputs from the classifier if it was really confident? In this case we could dramatically increase the precision but at the cost of not providing answers most of the time. So while the precision might go to 99%, if the classifier is only able to provide an answer 1% of the time, its not all that useful. To account for this, we need the recall metric. A high recall means that the classifier is providing answers most of the time. By raising the “confidence threshold” for our classifier we can increase its precision and lower its recall. A composite measure of both recall and precision is the F1 metric, which is the “harmonic mean” of the precision and recall. In many problems you will find that the F1 value peaks at some confidence threshold. We call this the peak F1 score.
Many times the primary metrics for a classifier will change depending on what confidence threshold you use. If you are interested to see the metric as a function of classifier confidence, you can simply calculate all the metrics at different condifence values and create a plot like this:
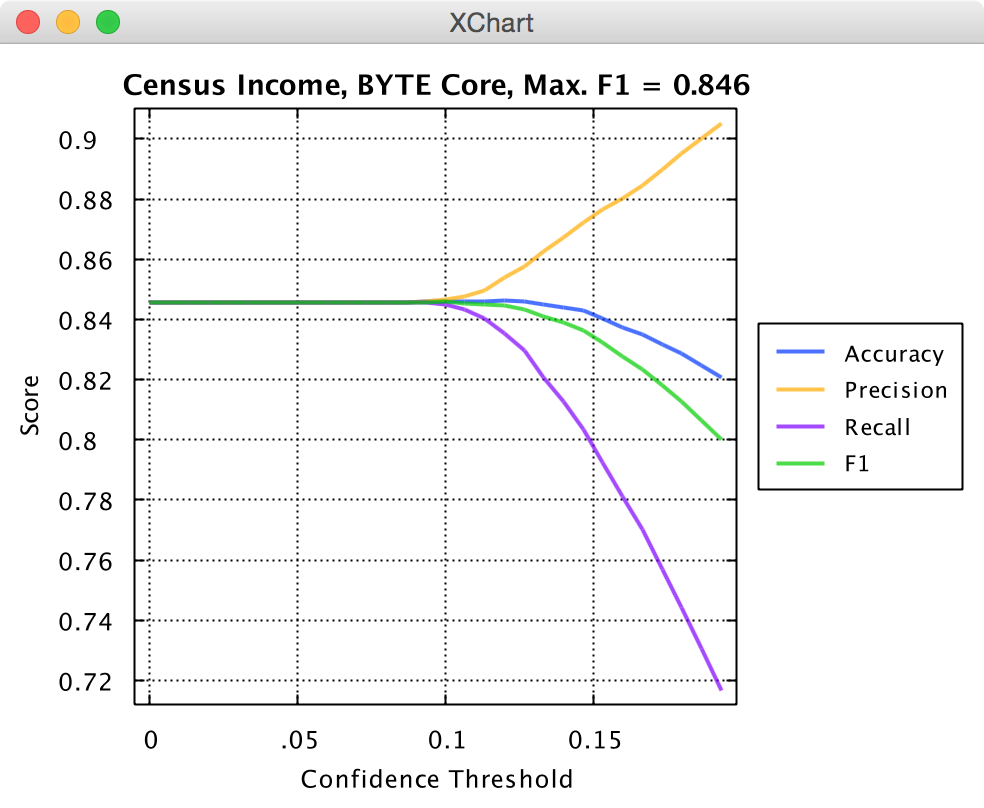
Knowm API Census Income Performance
Pulling the peak F1 score off the plot provides a good indication of your classifier’s performance in a general sense and can provide insight of what confidence value you should pick for classification.
Receiver Operating Characteristic (ROC)
The receiver operating characteristic (ROC), or ROC curve, is a graphical plot that illustrates the performance of a binary classification benchmarks as its confidence threshold is varied. The Equal error rate or crossover error rate (EER or CER): the rate at which both acceptance and rejection errors are equal, is a metric that often cited in the literature when comparing binary classifiers. The value of the EER can be easily obtained from the ROC curve by looking at where the ROC curve crosses the EER line. In general, the classifier with the lowest EER is the most accurate.
A typical ROC curve will look something like this:
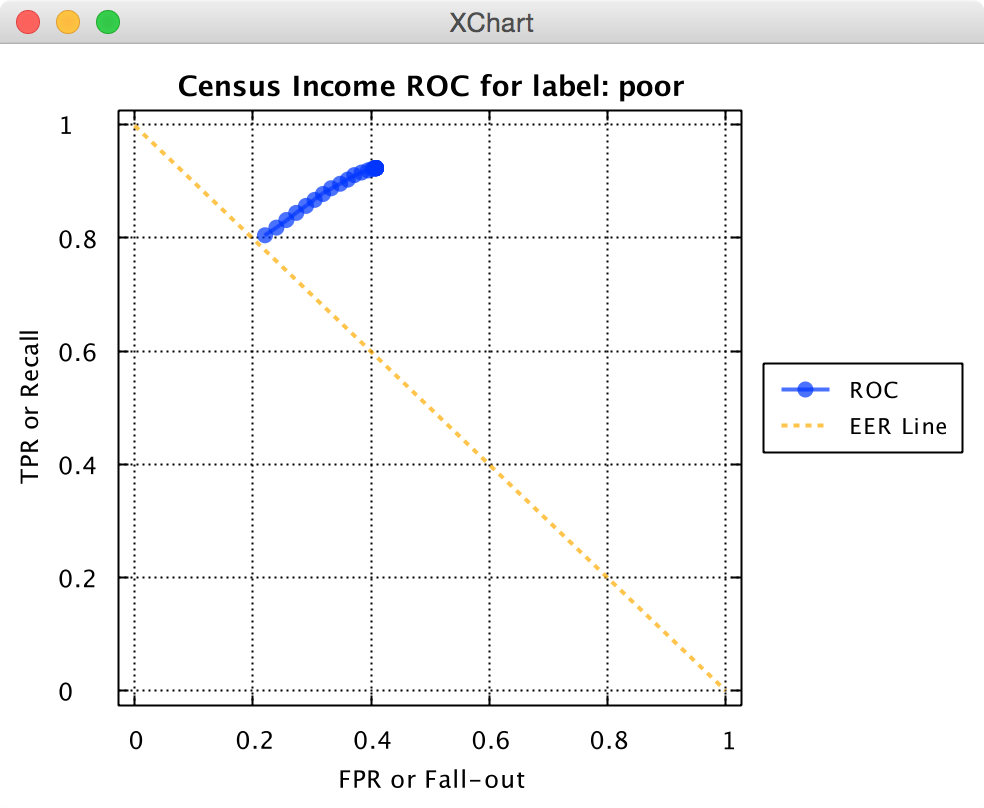
Knowm API Census Income ROC
, where the EER would be roughly 0.2.
Secondary Metrics: Energy Consumption, Speed, Volume
The purpose of technology is to solve a problem in the world. How well it solves this problem should be measured by a primary performance metric. Consider a fancy neuromemristive chip. It may have many applications such as machine vision, speech recognition, and natural language processing. In this case we need at least three primary metrics to access these capabilities. The energy consumption, speed, volume are secondary performance metrics. A chip that is exceptionally space and power efficient but does not perform at acceptable levels on a primary performance benchmark is useless! That’s why energy consumption, speed, volume are called secondary.
Machine Learning Secondary Metrics
| Measurement | Definition |
|---|---|
| Power | How much energy is dissipated in Watts |
| Speed | How fast the problem is solved in Seconds |
| Volume | Volume taken up by the hardware, and potentially also the power supply, in cubic centimeters |
Tradeoffs between primary and secondary performance benchmarks occur all the time. However, secondary metrics are only important if primary metrics have been achieved. A chip claiming very high power efficiency must also demonstrate acceptable primary performance metrics, otherwise its power-efficiency claim is meaningless and only serves as a distraction from its limitations.


Leave a Comment