 Elastic Search, Logstash and Kibana – the ELK Stack – is emerging as the best technology stack to collect, manage and visualize big data. If you came here looking for help installing the ELK stack, you don’t need an introduction, so let’s get right down to the dirty work. The following guide shows how to install Java 8, Elasticsearch 2.3, Logstash 2.3 and Kibana 4 on Ubuntu with init.d (
system v) or alternatively with systemd. You can do one or the other depending on your system and/or preferences. In two previous posts Integrate Bro IDS with ELK Stack and How to Install Bro Network Security Monitor on Ubuntu
, we showed how to install Bro and parse the generated Bro logs with Logstash. With the entire stack installed, running, and parsing logs generated by Bro, Kibana allows for a wonderful data analysis and discovery process. Of course, almost any data source can be used, and not just Bro.
Oracle Java 8
|
1 2 3 4 5 6 7 |
sudo add-apt-repository -y ppa:webupd8team/java sudo apt-get update echo debconf shared/accepted-oracle-license-v1-1 select true | sudo debconf-set-selections echo debconf shared/accepted-oracle-license-v1-1 seen true | sudo debconf-set-selections sudo apt-get -y install oracle-java8-installer java -version |
Elasticsearch
Note: Check for the latest Elastic Search release version here: downloads/elasticsearch
|
1 2 3 4 |
cd /var/cache/apt/archives sudo wget https://download.elastic.co/elasticsearch/release/org/elasticsearch/distribution/deb/elasticsearch/2.3.2/elasticsearch-2.3.2.deb sudo dpkg -i elasticsearch-2.3.2.deb |
System V
|
1 2 3 |
sudo update-rc.d elasticsearch defaults 95 10 sudo /etc/init.d/elasticsearch restart |
Systemd
|
1 2 3 |
sudo systemctl enable elasticsearch sudo systemctl restart elasticsearch |
Configure
|
1 2 3 4 |
cd /etc/elasticsearch sudo nano /etc/elasticsearch/elasticsearch.yml cd /var/log/elasticsearch |
Note: If you want to access your Elasticsearch instance from clients on a different IP address via Javascript, add the following inside elasticsearch.yml:
|
1 2 3 |
http.cors.enabled: true http.cors.allow-origin: "*" |
Also note that if you want to access Elasticsearch of any of the plugins like kopf from a host besides local host, you’ll need to add the following to elasticsearch.yml:
|
1 2 |
network.bind_host: 0 |
FYI, the Elasticsearch stores your actual data in /var/lib/elasticsearch/elasticsearch/nodes/....
Test
|
1 2 3 4 |
ps aux | grep elasticsearch curl -X GET 'http://localhost:9200' curl 'http://localhost:9200/_search?pretty' |
In browser: http://localhost:9200/
Hello World Data
|
1 2 3 |
curl -X POST 'http://localhost:9200/tutorial/helloworld/1' -d '{ "message": "Hello World!" }' curl -X GET 'http://localhost:9200/tutorial/helloworld/1?pretty=true' |
Debugging
|
1 2 |
tail -f /var/log/elasticsearch/elasticsearch.log |
Debug startup errors by running elasticsearch in the console
|
1 2 |
sudo -u elasticsearch /usr/share/elasticsearch/bin/elasticsearch -d -p /var/run/elasticsearch.pid --path.conf=/etc/elasticsearch --default.path.home=/usr/share/elasticsearch --default.path.logs=/var/log/elasticsearch --default.path.data=/var/lib/elasticsearch --default.path.work=/tmp/elasticsearch --default.path.conf=/etc/elasticsearch |
Elasticsearch Kopf Plugin (an aside)
The kopf plugin provides an admin GUI for Elasticsearch. It helps in debugging and managing clusters and shards. It’s really easy to install (check here for latest verion):
|
1 2 |
sudo /usr/share/elasticsearch/bin/plugin install lmenezes/elasticsearch-kopf/v2.1.2 |
View in browser at: http://localhost:9200/_plugin/kopf/#!/cluster. You should see something like this:
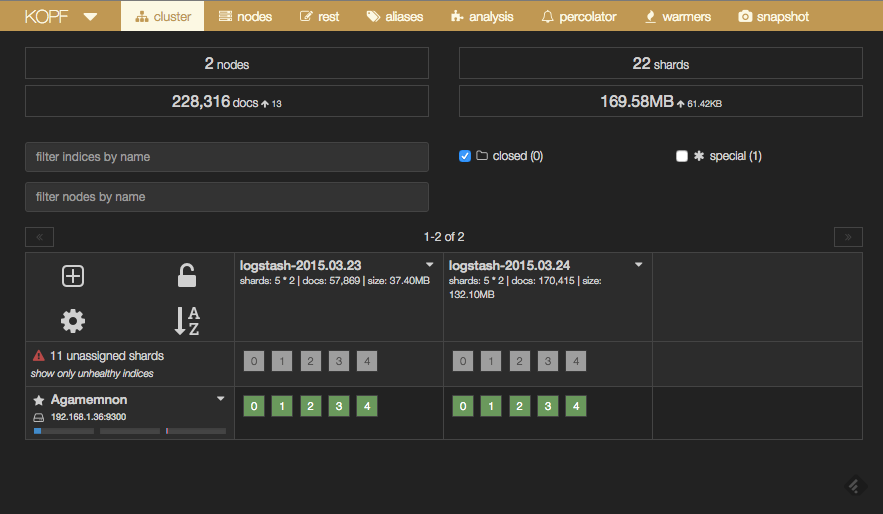
Elasticsearch Kopf
Logstash
Note: Check for the latest Logstash release version here: downloads/logstash
|
1 2 3 4 |
cd /var/cache/apt/archives sudo wget https://download.elastic.co/logstash/logstash/packages/debian/logstash_2.3.2-1_all.deb sudo dpkg -i logstash_2.3.2-1_all.deb |
System V
|
1 2 3 |
sudo update-rc.d logstash defaults 95 10 sudo /etc/init.d/logstash restart |
Systemd
|
1 2 3 |
sudo systemctl enable logstash sudo systemctl restart logstash |
Configure
By default Logstash filters will only work on a single thread, and thus also one CPU core. To increase the number of cores available to LogStash, edit the file /etc/default/logstash and set the -w parameter to the number of cores: LS_OPTS="-w 8".
|
1 2 3 |
lscpu sudo nano /etc/default/logstash |
You can increase the Java heap size here as well. Make sure to uncomment the line you are updating. Don’t forget to restart logstash afterwards.
|
1 2 3 |
LS_OPTS="-w 8" LS_HEAP_SIZE="1024m" |
Test
|
1 2 |
ps aux | grep logstash |
Directly change java options in script if you are starting logstash from the command line and not as a linux service.
|
1 2 |
sudo nano /opt/logstash/bin/logstash |
Hello World (warning Logstash at the command line is slow to start, so be patient)
|
1 2 3 4 |
sudo -u logstash /opt/logstash/bin/logstash -e 'input { stdin { } } output { stdout {} }' # then type 'hello world' sudo -u logstash /opt/logstash/bin/logstash -e 'input { stdin { } } output { stdout { codec => rubydebug } }' # then type `goodnight moon` |
Hello World with Elastic Search
|
1 2 |
sudo -u logstash /opt/logstash/bin/logstash -e 'input { stdin { } } output { elasticsearch { host => localhost } }' # then type 'hello' |
Plugins
For non-standard parsing features, we access plugins. The following terminal commands show how to install the logstash-filter-translate plugin. For a more in-depth explanation of installing logstash plugins see How to Install Logstash Plugins for Version 1.5.
|
1 2 3 |
cd /opt/logstash sudo bin/plugin install logstash-filter-translate |
Kibana
Note: Check for the latest Kibana release version here: downloads/kibana
|
1 2 3 4 |
cd /var/cache/apt/archives sudo wget https://download.elastic.co/kibana/kibana/kibana_4.5.0_amd64.deb sudo dpkg -i kibana_4.5.0_amd64.deb |
System V
|
1 2 3 |
sudo update-rc.d kibana defaults 95 10 sudo /etc/init.d/kibana restart |
Systemd
|
1 2 3 |
sudo systemctl enable kibana sudo systemctl restart kibana |
Configure
|
1 2 3 |
sudo nano ./kibana/config/kibana.yml # Set the elasticsearch_url to point at your Elasticsearch instance, which is localhost by default |
Test
In browser: http://localhost:5601
Final Words
If all went well, the next step is to tap into a datasource with Logstash and view it with Kibana. In two previous posts Integrate Bro IDS with ELK Stack and How to Install Bro Network Security Monitor on Ubuntu
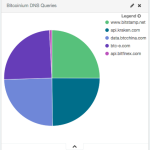
, we showed how to install Bro and parse the generated Bro logs with Logstash. The following is a screen shot from a Kibana dashboard we made for one of our websites bitcoinium.com showing some nice bar and pie charts. Once everything is set up and running it immediately becomes clear how useful the ELK stack is.
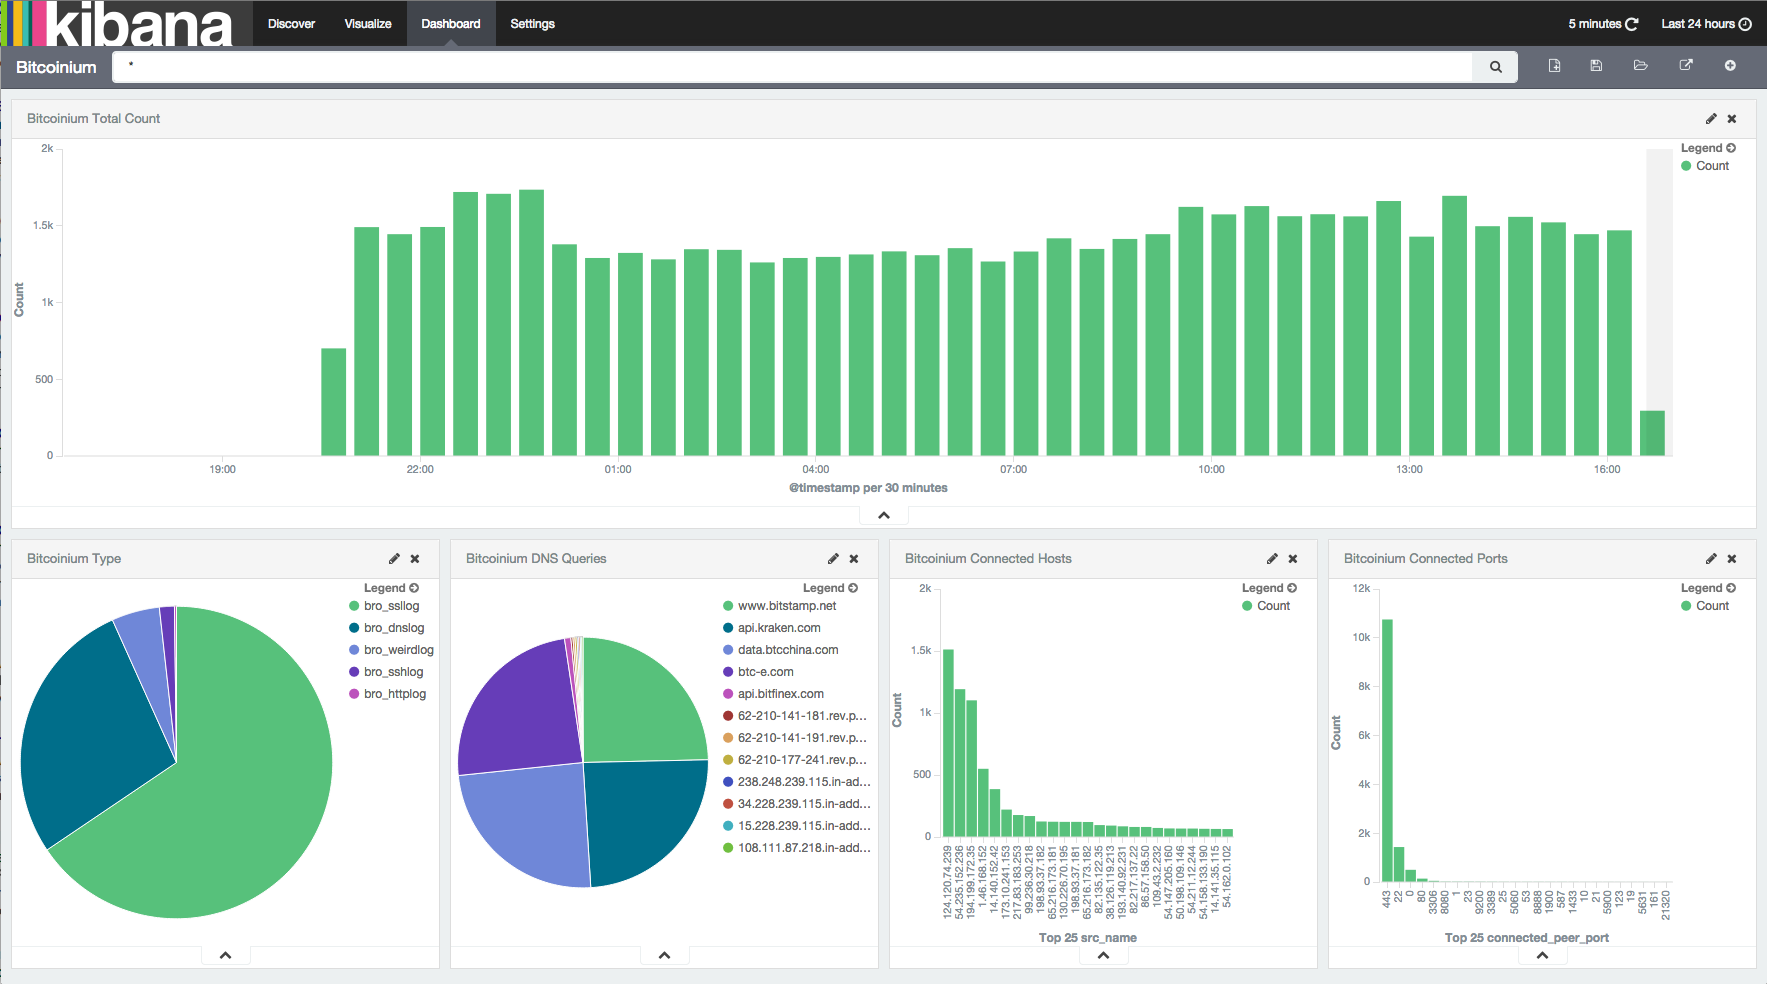
ELK Stack for Bitcoinium
Related Resources
Integrating Bro with the ELK Stack: http://knowm.org/integrate-bro-ids-with-elk-stack/
How to Created a Bonded Network Interface: http://knowm.org/how-to-create-a-bonded-network-interface/


7 Comments
PrasannaKumar
I try to install kibana on ubuntu 14.04. When I run ./bin/kibana i have errors :
./bin/../node/bin/node: 1: ./bin/../node/bin/node:ELF: not found
./bin/../node/bin/node: 2: ./bin/../node/bin/node: W: not found
./bin/../node/bin/node: 2: ./bin/../node/bin/node: -NE: not found
./bin/../node/bin/node: 4: ./bin/../node/bin/node: Syntax error: “(” unexpected
Tim Molter
Ask for help at https://groups.google.com/forum/#!forum/elasticsearch. I’ve never seen that issue and I’ve installed Kibana before on Ubuntu 14.04 LTS.
semako Fasinu
I had the same error. It is a platform error. I used this kibana – hxxps://download.elasticsearch.org/kibana/kibana/kibana-4.0.2-linux-x64.tar.gz so what i did was to delete the it and install the appropriate one, which is hxxps://download.elasticsearch.org/kibana/kibana/kibana-4.0.2-linux-x86.tar.gz and everything was fine thereafter. You may need to change from one to the other depending on the one you used earlier. Hope this helps
ELK stack installation and configuration - DexPage
[…] You didn’t provide much information to base an answer on, so it is a bit difficult to give you any specific help. You should start over with the installation, carefully stepping through each requirement. I would suggest the following guide as a starting point, which includes a few troubleshooting tips: How to Set Up the ELK Stack- Elasticsearch, Logstash and Kibana . […]
Justin M
I got the same issue as PrasannaKumar, so I tried to switch to the other platforms but it made it worse. No I get bin/.node/bin/node: syntax error: “(” unexpected
Ibrahim
wow, very clean and easy way to install, for me its 100% succeess,great job
Macarena
Very good tutorial, thank you for making it! Really simple and effective. I replaced the file versions with the actual downloadable versions and installation was flawless.
Two little mistakes:
For the kopf installation:
you don\’t need the \”-install\” just write \”install\” (withouth the dash)
and with the Hello World with Elastic Search:
instead of \”host\” you need hosts with 2.2.2 version
Thanks again!