TL;DR
|
1 2 3 4 5 6 7 8 9 |
JPanel chartPanel = new XChartPanel<Chart>(chart); // for embedding swing in javafx //javafx.embed.swing.SwingNode;<---need this dependency SwingNode swingNode = new SwingNode(); swingNode.setContent(chartPanel); chartArea.getChildren().add(swingNode); } |
…and dont forget to add the javafx-swing dependency to your pom.xml (Maven):
|
1 2 3 4 5 |
<dependency> <groupId>org.openjfx</groupId> <artifactId>javafx-swing</artifactId> <version>13</version> </dependency> |
XChart is Awesome
Looking for a full-featured open source charting library? Knowm XChart has been gaining in popularity as more and more chart types have been added. While JavaFX comes with some simple default chart types (Area, Bar, Bubble, Line, Pie, Scatter), perhaps you are looking for more flexible charting API or perhaps you have already built an application with XChart and are just looking to port your code over to JavaFX. Here are some reasons to use XChart:
- No required additional dependencies, ~182KB Jar, Java 8 and up
- Multiple Y-Axis charts
- Line charts
- Step charts
- Scatter charts
- Area charts
- Step Area charts
- Bar charts
- Histogram charts
- Pie charts
- Donut charts
- Bubble charts
- Stick charts
- Dial charts
- Radar charts
- OHLC charts
- Box Plot
- Error bars
- Logarithmic axes
- Number, Date, Bubble and Category X-Axis
- Multiple series
- Tool tips
- Extensive customization
- Themes – XChart, GGPlot2, Matlab
- Right-click, Save-As…
- User-defined axes range
- Definable legend placement
- CSV import and export
- High resolution chart export
- Export as PNG, JPG, BMP, GIF with custom DPI setting
- Export SVG, EPS using optional de.erichseifert.vectorgraphics2d library
- Export PDF using optional pdfbox-graphics2d library
- Real-time charts
The JavaFX Code
We will create a simple JavaFX application that will display an example XChart in a resizable window when the user selects this option from the menu. Lets first define the GUI with a .fxml file:
|
1 2 3 4 5 6 7 8 9 10 11 12 13 14 15 16 17 18 19 20 21 22 23 24 |
<?xml version="1.0" encoding="UTF-8"?> <?import javafx.scene.control.Menu?> <?import javafx.scene.control.MenuBar?> <?import javafx.scene.control.MenuItem?> <?import javafx.scene.layout.AnchorPane?> <?import javafx.scene.layout.VBox?> <VBox prefHeight="600.0" prefWidth="900.0" xmlns="http://javafx.com/javafx/11.0.1" xmlns:fx="http://javafx.com/fxml/1" fx:controller="com.knowm.xfxchart.App"> <children> <MenuBar VBox.vgrow="NEVER"> <menus> <Menu mnemonicParsing="false" text="Choose"> <items> <MenuItem mnemonicParsing="false" onAction="#xyChart" text="XY Chart" /> <MenuItem mnemonicParsing="false" onAction="#pieChart" text="Pie Chart" /> <MenuItem mnemonicParsing="false" onAction="#areaChart" text="Area Chart" /> </items> </Menu> </menus> </MenuBar> <AnchorPane fx:id="chartArea" /> </children> </VBox> |
And our application code:
|
1 2 3 4 5 6 7 8 9 10 11 12 13 14 15 16 17 18 19 20 21 22 23 24 25 26 27 28 29 30 31 32 33 34 35 36 37 38 39 40 41 42 43 44 45 46 47 48 49 50 51 52 53 54 55 56 57 58 59 60 61 62 63 64 65 66 67 68 69 70 71 72 73 74 75 76 77 78 79 80 81 82 83 84 85 86 87 88 89 90 91 92 93 94 95 96 97 98 99 100 101 102 103 104 105 106 107 108 109 110 111 112 113 114 115 116 117 118 119 120 121 122 123 124 125 126 127 128 129 130 131 132 133 134 135 136 137 138 139 140 141 142 |
package com.knowm.xfxchart; import javafx.application.Application; import javafx.application.Platform; import javafx.embed.swing.SwingNode; import javafx.fxml.FXML; import javafx.fxml.FXMLLoader; import javafx.scene.Scene; import javafx.scene.layout.AnchorPane; import javafx.stage.Stage; import java.awt.Color; import java.io.IOException; import javax.swing.JPanel; import org.knowm.xchart.PieChart; import org.knowm.xchart.PieChartBuilder; import org.knowm.xchart.QuickChart; import org.knowm.xchart.XChartPanel; import org.knowm.xchart.XYChart; import org.knowm.xchart.XYChartBuilder; import org.knowm.xchart.XYSeries.XYSeriesRenderStyle; import org.knowm.xchart.internal.chartpart.Chart; import org.knowm.xchart.style.Styler.LegendPosition; /** * JavaFX App */ public class App extends Application { private static Scene scene; @FXML private AnchorPane chartArea;// for injecting the XChart public static void main(String[] args) { launch(); } @Override public void start(Stage stage) throws IOException { FXMLLoader fxmlLoader = new FXMLLoader(App.class.getResource("xchart.fxml")); scene = new Scene(fxmlLoader.load()); stage.setScene(scene); stage.show(); } @FXML public void xyChart() { Platform.runLater(new Runnable() { @Override public void run() { buildXYChart(); } }); } @FXML public void areaChart() { Platform.runLater(new Runnable() { @Override public void run() { buildAreaChart(); } }); } @FXML public void pieChart() { Platform.runLater(new Runnable() { @Override public void run() { buildPieChart(); } }); } private void showChart(Chart chart) { JPanel chartPanel = new XChartPanel<Chart>(chart); // for embeding swing in javafx SwingNode swingNode = new SwingNode(); swingNode.setContent(chartPanel); // for resizing plot to window AnchorPane.setLeftAnchor(swingNode, 0.0); AnchorPane.setRightAnchor(swingNode, 0.0); AnchorPane.setTopAnchor(swingNode, 0.0); AnchorPane.setBottomAnchor(swingNode, 0.0); // add chart to the chart area chartArea.getChildren().add(swingNode); } private void buildPieChart() { // Create Chart PieChart pieChart = new PieChartBuilder().width(800).height(600).title(getClass().getSimpleName()).build(); // Customize Chart Color[] sliceColors = new Color[] { new Color(224, 68, 14), new Color(230, 105, 62), new Color(236, 143, 110), new Color(243, 180, 159), new Color(246, 199, 182) }; pieChart.getStyler().setSeriesColors(sliceColors); // Series pieChart.addSeries("Gold", 24); pieChart.addSeries("Silver", 21); pieChart.addSeries("Platinum", 39); pieChart.addSeries("Copper", 17); pieChart.addSeries("Zinc", 40); showChart((Chart) pieChart); } private void buildXYChart() { double[] xData = new double[] { 0.0, 1.0, 2.0 }; double[] yData = new double[] { 2.0, 1.0, 0.0 }; // Create Chart XYChart xchart = QuickChart.getChart("Sample Chart", "X", "Y", "y(x)", xData, yData); showChart(xchart); } private void buildAreaChart() { // Create Chart final XYChart xchart = new XYChartBuilder().title("Area Chart").xAxisTitle("X").yAxisTitle("Y").build(); // Customize Chart xchart.getStyler().setLegendPosition(LegendPosition.InsideNE); xchart.getStyler().setDefaultSeriesRenderStyle(XYSeriesRenderStyle.Area); // Series xchart.addSeries("a", new double[] { 0, 3, 5, 7, 9 }, new double[] { -3, 5, 9, 6, 5 }); xchart.addSeries("b", new double[] { 0, 2, 4, 6, 9 }, new double[] { -1, 6, 4, 0, 4 }); xchart.addSeries("c", new double[] { 0, 1, 3, 8, 9 }, new double[] { -2, -1, 1, 0, 1 }); showChart(xchart); } } |
The most relevant code is contained in the showChart() method. We simply need to embed the swing content (JPanel) inside of a SwingNode:
|
1 2 3 4 5 6 |
JPanel chartPanel = new XChartPanel<Chart>(chart); // for embeding swing in javafx SwingNode swingNode = new SwingNode(); swingNode.setContent(chartPanel) } |
To insure the xChart resizes to its parent window, we add it to the AnchorPane and set it’s anchors:
|
1 2 3 4 5 |
AnchorPane.setLeftAnchor(swingNode, 0.0); AnchorPane.setRightAnchor(swingNode, 0.0); AnchorPane.setTopAnchor(swingNode, 0.0); AnchorPane.setBottomAnchor(swingNode, 0.0); } |
Finally, we add the swing node as a child of the AnchorPane:
|
1 2 3 |
// add chart to the chart area chartArea.getChildren().add(swingNode); } |
And that’s all there is to it.
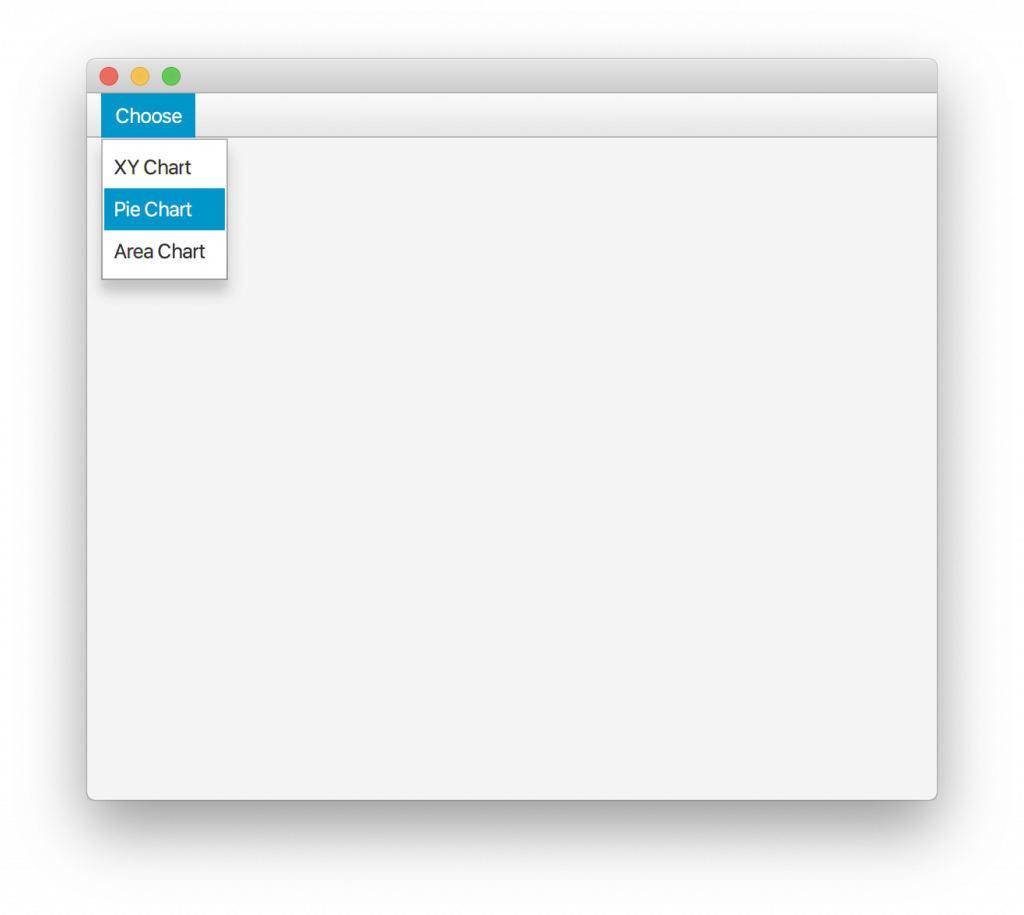
Java XChart in JavaFX
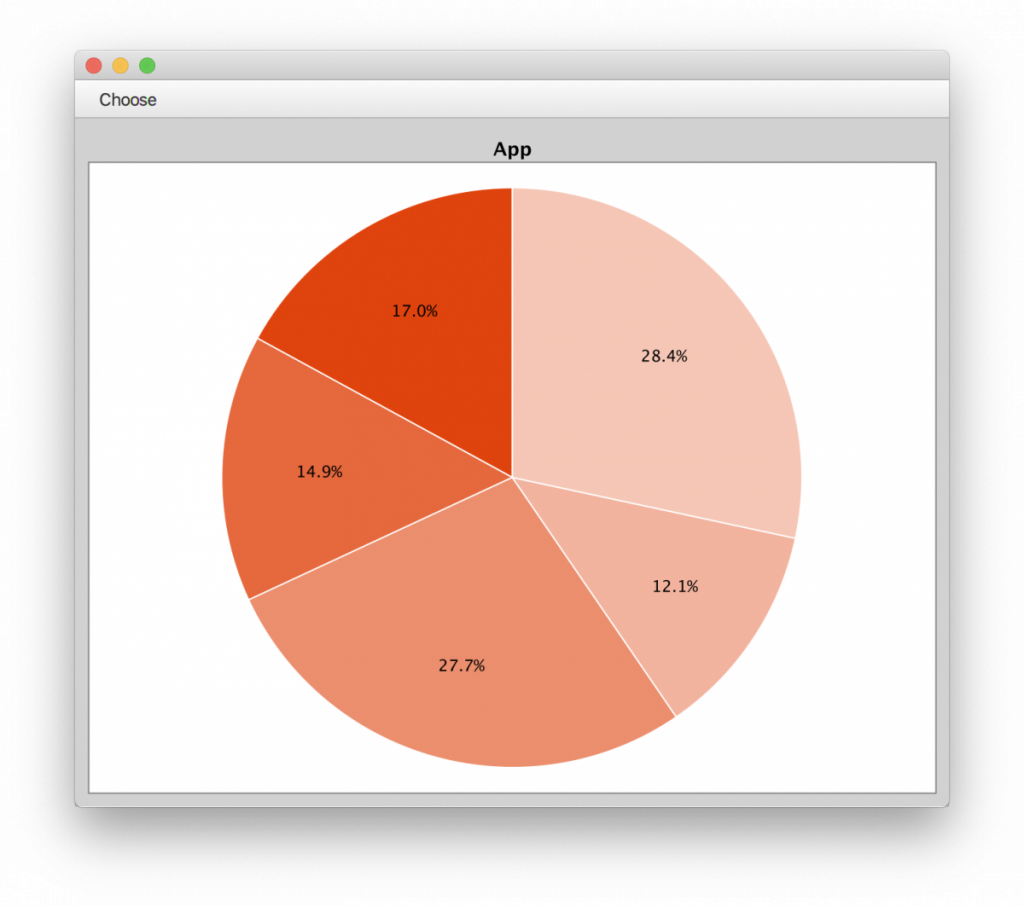
Java XChart in JavaFX









Leave a Comment