Introduction to Clustering
Unsupervised learning is a machine learning method used to draw inferences from datasets consisting of input data without labeled responses [1]. In other words, it’s learning without the answer key.
Knowledge discovery of this type can be automatically applied to a data source. Generally, it is used as a process to find meaningful structure, explanatory underlying processes, generative features , and groupings inherent in a set of examples.
The last of these, clustering, is the task of grouping a set of objects in such a way that objects in the same group are more “similar” to each other than those in other groups. Examples include the stars of the galactic clusters in the image below, which are linked together because of their spatial similarity, in a geometrical sense.

Image by Hubble Heritage 
Organizing information into clusters uncovers a relationship between objects. This relationship may give us insight into the internal structure of data; highlighting underlying rules and recurring patterns. It may also segment information effectively for visualization or as preprocessing step for reducing the dimensionality of information – an important step before further machine learning algorithms are applied and under some introspection, a useful task of our own intelligent behavior.
Clustering of “similar” objects is an inherently ambiguous task unless a measure of similarity is well defined. For instance, we were possibly quick to cluster the stars in the image above by linking stars spatially. It could just as easily been achieved by connecting stars of similar age, type or any other attribute.
Clustering is inherently ambiguous if the “similarity” of objects is not well defined
Clustering algorithms must make assumptions about what constitutes the similarity of points and naturally, different assumptions create different and equally valid clusters. It is up to the individual to decide which is definitive.
This ambiguity sets clustering apart from other supervised methods – where ground truth is supplied, and performance is quantitative. Instead, clustering techniques need to be evaluated in terms of their end use. Often in terms of their ability to improve a supervised method or on human judgment.
Methods
There are many algorithms for uncovering clusters in a dataset. These can be broadly categorized via their measure of similarity: Centroid, distribution, and connectivity based methods. We outline a number of these below.
Distribution-Based Methods
Distribution based models, like Expectation maximation (EM), relate units based on their likely hood of belonging to the same probability distribution [5].
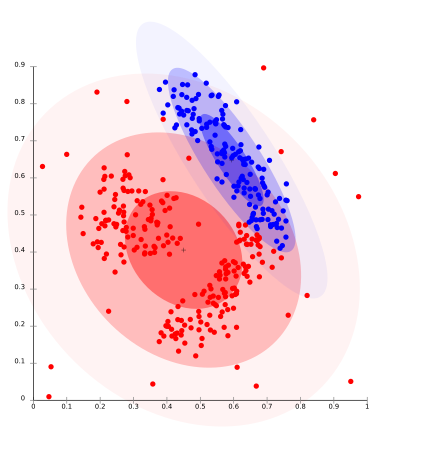
One prominent method is known as Gaussian mixture models which attempts to find gaussian distributions which fit the data well. Usually a fixed number of distributions are created (to avoid overfitting) and iteratively updated to fit the data distribution such that the likely hood of the data given the distributions is maximized. This creates groupings like those seen in the image below.
In practice, distribution based models perform well on synthetic data ( because these points are often generated by a known probability distribution). GMM has also been shown to perform well on a large number of diversely sized clusters. Problems arise in distribution based clustering if constraints are not used to limit the model’s complexity. Furthermore, Distribution-based clustering produces clusters which assume concisely defined mathematical models underlying the data, a rather strong assumption for some data distributions.
Centroid-Based Methods
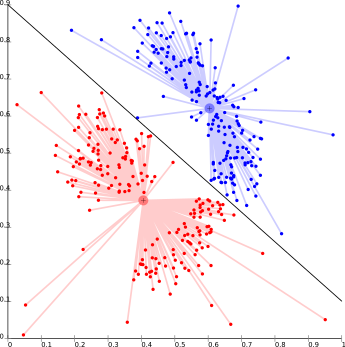
Centroid-based clustering methods, such as K-means, cluster units based on their distance from a number of centers [2]. Commonly k is set beforehand and a number of cluster centers are found which minimize the distance between points in the data set and each cluster center. The problem is known to be NP-hard and thus solutions are commonly approximated over a number of trials.
The biggest drawback of k-means-type algorithms is that they require the number of clusters k to be specified in advance. This causes problems for clustering data when the number of clusters cannot be known beforehand. K-means also has trouble clustering density based distributions like those in the image below or those that are not linear separable.
Connectivity-Based Methods
Connectivity-based clustering, also known as hierarchical clustering, is based on the core idea of objects being more related to nearby objects than to objects farther away. This is similar to centroid-based clustering but instead of having clusters defined by a set of centers, clusters are described by the maximum distance needed to connect parts of the cluster. Changing this constant will create different clusters.
Connectivity-based clustering usually does not provide single partitioning of the data set, but instead provides an extensive hierarchy of clusters that merge with each other at certain distances. The whole family of connectivity based methods can be created based on the way distances are computed.
One of those is density-based clustering, which include methods such as OPTICS and DBSCAN. These methods form clusters by linking points who are within a predefined radius of other points within a cluster [4]. It labels points outside these as either clusters or noise.
Unfortunately, noise and outliers in datasets can cause problems for connectivity based methods since they either show up as additional clusters, which increases the complexity of your clustering or causes clusters to merge improperly. Additionally, density based methods can fail if the clusters are of various densities [3].
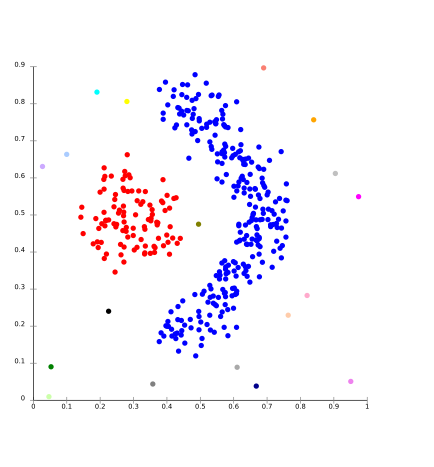
Image by Chire SLINK Clustering
References
[1] Jain AK, Murty MN, Flynn PJ (1999) Data clustering: a review. ACM Computing Surveys (CSUR) 31: 264–323. doi: 10.1145/331499.331504
[2]. Lloyd S (1982) Least squares quantization in PCM. IEEE Transactions on Information Theory 28: 129–137. doi: 10.1109/tit.1982.1056489
[3]. Kriegel HP, Kröger P, Sander J, Zimek A (2011) Density-based clustering. Wiley Interdisciplinary Reviews: Data Mining and Knowledge Discovery 1: 231–240. doi: 10.1002/widm.30
[4] Ankerst M, Breunig MM, Kriegel HP, Sander J (1999) OPTICS: ordering points to identify the clustering structure. ACM SIGMOD Record 28: 49–60. doi: 10.1145/304181.304187
[5] Dempster AP, Laird NM, Rubin DB (1977) Maximum likelihood from incomplete data via the EM algorithm. Journal of the Royal Statistical Society: Series B 39: 1–38.
View Article PubMed/NCBI Google Scholar














Leave a Comment