
XChart
Simple Java Real-time Java Chart Example
Creating real-time charts is as simple as calling updateXYSeries for one or more series objects through the XYChart instance and triggering a redraw of the JPanel containing the chart. This works for all chart types including XYChart, CategoryChart, BubbleChart and PieChart, for which example source code can be found here. Examples demonstrate using the SwingWrapper with repaintChart() method as shown here, as well as XChartPanel with revalidate() and repaint(), which you would want to use if you already had your own Java Swing application which integrates an XChartPanel.
The following sample code used to generate the following real-time chart can be found here.
|
1 2 3 4 5 6 7 8 9 10 11 12 13 14 15 16 17 18 19 20 21 22 23 24 25 26 27 28 29 30 31 32 33 34 35 36 37 38 39 40 41 42 43 44 45 46 47 |
import org.knowm.xchart.QuickChart; import org.knowm.xchart.SwingWrapper; import org.knowm.xchart.XYChart; /** * Creates a simple real-time chart */ public class SimpleRealTime { public static void main(String[] args) throws Exception { double phase = 0; double[][] initdata = getSineData(phase); // Create Chart final XYChart chart = QuickChart.getChart("Simple XChart Real-time Demo", "Radians", "Sine", "sine", initdata[0], initdata[1]); // Show it final SwingWrapper<XYChart> sw = new SwingWrapper<XYChart>(chart); sw.displayChart(); while (true) { phase += 2 * Math.PI * 2 / 20.0; Thread.sleep(100); final double[][] data = getSineData(phase); chart.updateXYSeries("sine", data[0], data[1], null); sw.repaintChart(); } } private static double[][] getSineData(double phase) { double[] xData = new double[100]; double[] yData = new double[100]; for (int i = 0; i < xData.length; i++) { double radians = phase + (2 * Math.PI / xData.length * i); xData[i] = radians; yData[i] = Math.sin(radians); } return new double[][] { xData, yData }; } } |
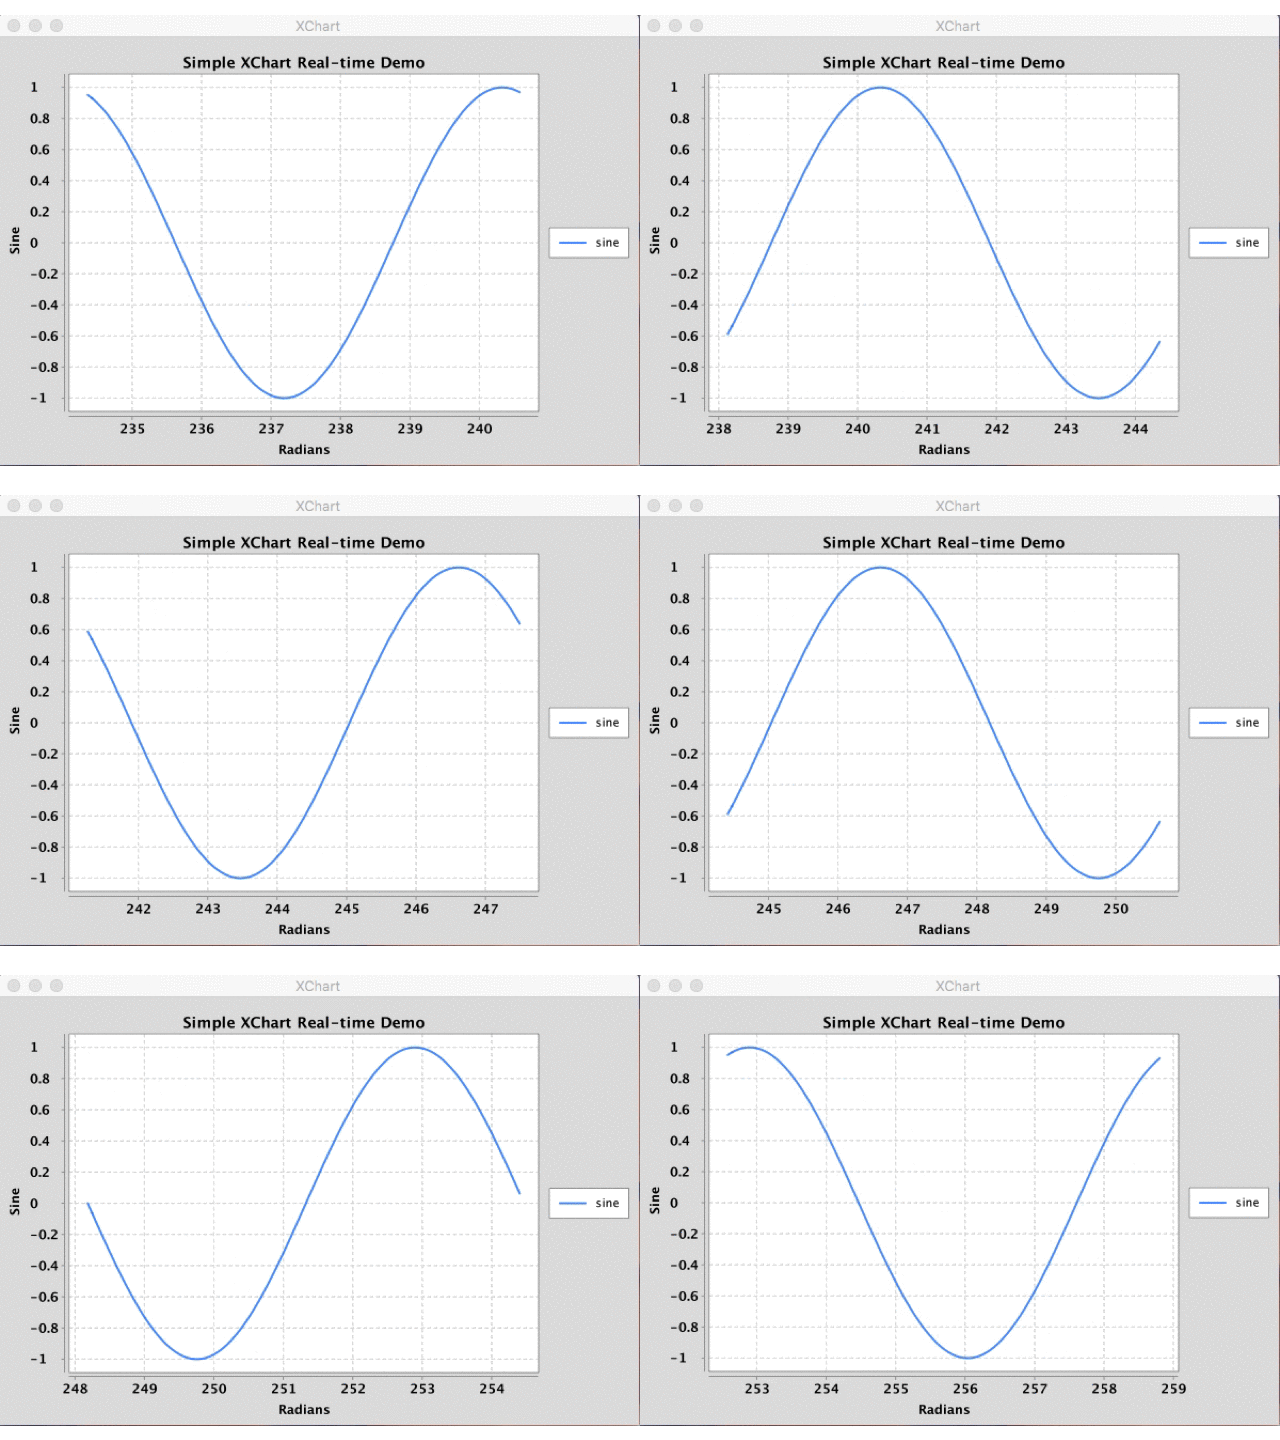
XChart Simple Realtime Java Chart
Swing Worker Java Real-time Java Chart Example
In the above example, the chart data generation runs on the EventDispatchThread, which is definitely not ideal for a responsive GUI. Additionally, the EventDispatchThread is forced to sleep for 100 ms between each update to the real-time chart. While far from the correct way to build a Java Swing application, it serves the purpose of demonstrating how the XChart components function.
In this example, lets use an additional thread to do the data generation, rather than the EventDispatchThread. This good-practice technique allows for your GUI to remain responsive to user interactions while the charting goes on in the background–except for when it comes time to actually repaint the chart. The SwingWorker thread is a special thread that handles the complicated details for you when updating the GUI running on the EventDispatchThread.
This example simulates a common scenario in making real-time charting applications: There is some background thread reading data from a sensor, and you want a live chart to update as new data becomes available. Sometimes however, you don’t know how often the data is being updated. One problem could be that the data is coming in way faster than you’d ever want to repaint a chart. For example, it doesn’t make any sense to update the chart on every single new datapoint if the data rate is faster than the screen refresh rate, for example 24 points per second. So in this example we simulate a data rate of 5 ms per data point and a chart update rate of 24 frames per second, dynamically calculated. The chart animation looks smooth, and no extra CPU cycles are being wasted updating the chart for no reason.
The following sample code used to generate the following real-time chart can be found here.
|
1 2 3 4 5 6 7 8 9 10 11 12 13 14 15 16 17 18 19 20 21 22 23 24 25 26 27 28 29 30 31 32 33 34 35 36 37 38 39 40 41 42 43 44 45 46 47 48 49 50 51 52 53 54 55 56 57 58 59 60 61 62 63 64 65 66 67 68 69 70 71 72 73 74 75 76 77 78 79 80 81 82 83 84 85 86 87 88 89 90 91 92 93 94 95 96 97 |
import java.util.LinkedList; import java.util.List; import javax.swing.SwingWorker; import org.knowm.xchart.QuickChart; import org.knowm.xchart.SwingWrapper; import org.knowm.xchart.XYChart; /** * Creates a real-time chart using SwingWorker */ public class SwingWorkerRealTime { MySwingWorker mySwingWorker; SwingWrapper<XYChart> sw; XYChart chart; public static void main(String[] args) throws Exception { SwingWorkerRealTime swingWorkerRealTime = new SwingWorkerRealTime(); swingWorkerRealTime.go(); } private void go() { // Create Chart chart = QuickChart.getChart("SwingWorker XChart Real-time Demo", "Time", "Value", "randomWalk", new double[] { 0 }, new double[] { 0 }); chart.getStyler().setLegendVisible(false); chart.getStyler().setXAxisTicksVisible(false); // Show it sw = new SwingWrapper<XYChart>(chart); sw.displayChart(); mySwingWorker = new MySwingWorker(); mySwingWorker.execute(); } private class MySwingWorker extends SwingWorker<Boolean, double[]> { LinkedList<Double> fifo = new LinkedList<Double>(); public MySwingWorker() { fifo.add(0.0); } @Override protected Boolean doInBackground() throws Exception { while (!isCancelled()) { fifo.add(fifo.get(fifo.size() - 1) + Math.random() - .5); if (fifo.size() > 500) { fifo.removeFirst(); } double[] array = new double[fifo.size()]; for (int i = 0; i < fifo.size(); i++) { array[i] = fifo.get(i); } publish(array); try { Thread.sleep(5); } catch (InterruptedException e) { // eat it. caught when interrupt is called System.out.println("MySwingWorker shut down."); } } return true; } @Override protected void process(List<double[]> chunks) { System.out.println("number of chunks: " + chunks.size()); double[] mostRecentDataSet = chunks.get(chunks.size() - 1); chart.updateXYSeries("randomWalk", null, mostRecentDataSet, null); sw.repaintChart(); long start = System.currentTimeMillis(); long duration = System.currentTimeMillis() - start; try { Thread.sleep(40 - duration); // 40 ms ==> 25fps // Thread.sleep(400 - duration); // 40 ms ==> 2.5fps } catch (InterruptedException e) { } } } } |
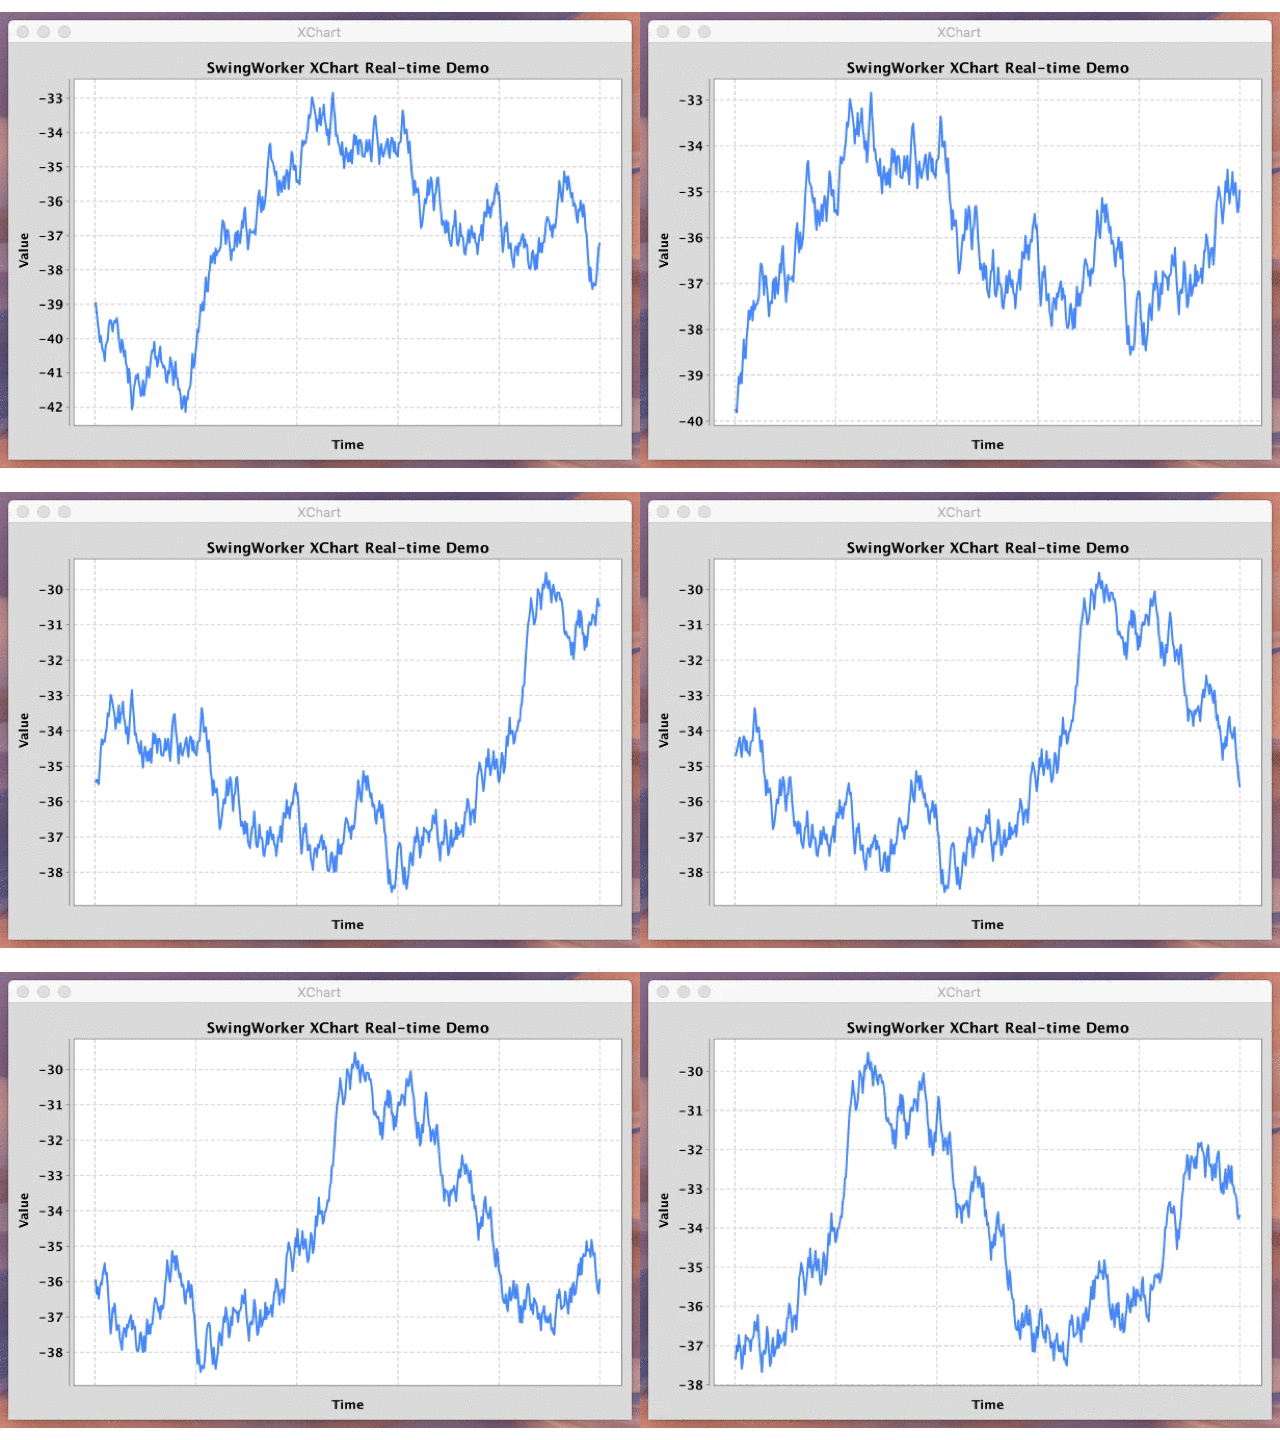
XChart SwingWorker Realtime Java Chart
Further Reading
XYChart,CategoryChart,BubbleChartandPieChartReal-time charts Example Code- XChart on Knowm.org
- XChart on Github







6 Comments
Ag Ag
where do i get the reference for below files
import org.knowm.xchart.QuickChart;
import org.knowm.xchart.SwingWrapper;
import org.knowm.xchart.XYChart;
Tim Molter
https://github.com/knowm/XChart
Sharia
Hi Tim,
Great job.
Couple of questions:
– Is there a way to overlay multiple charts?. I want to be able to show moving averages along with OHLC charts. Is this possible?
– Is it possible to tie models to the charts – instead of array of data (similar to something like tableModel in Swing)? so that changes in the model immediately gets reflected in the charts?.
Thanks
Tim Molter
Hello Sharia, no it’s not yet possible to overlay a line chart on an OHLC chart. It’s also not possible to tie models to the chart. Sorry!
John
Am I able to use this code in the making of an android app
Thanks
Bijumon Janardhanan
Tried this with an increased amount of data and it eats up the processor. repaintXYXhart delay is not proportional to the actual time taken to update the frame. If you post more data refresh rate got affected. You still can post data but refresh may be much slower.