
XChart
Simple Java Charts
A Simple Charting Library for Java
XChart is a light-weight and convenient library for plotting data. Its focus is on simplicity and ease-of-use, requiring only two lines of code to save or display a basic default chart.
Usage is very simple: Create a Chart instance, add a series of data to it, and either save it or display it.
Features
- No required additional dependencies
- Multiple Y-Axis charts
- Line charts
- Scatter charts
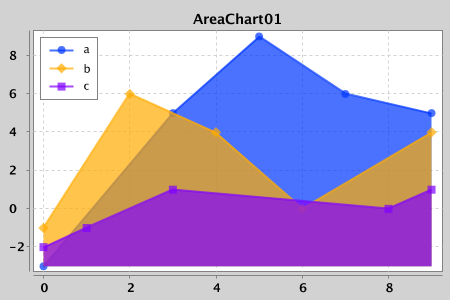
- Area charts
- Bar charts
- Histogram charts
- Pie charts
- Donut charts
- Bubble charts
- Stick charts
- Dial charts
- Radar charts
- OHLC charts
- Box charts
- Heat maps
- Error bars
- Logarithmic axes
- Number, Date and Category X-Axis
- Multiple series
- Tool tips
- Extensive customization
- Themes – XChart, GGPlot2, MATLAB
- Right-click, Save-As…
- User-defined axes range
- Definable legend placement
- CSV import and export
- High resolution chart export
- Export as PNG, JPG, BMP and GIF
- Export SVG, EPS and PDF using optional de.erichseifert.vectorgraphics2d library
- Real-time charts
- Java 8 and up
What’s Next?
Now go ahead and study some examples, download the thing and provide feedback.
Simplicity
Simplicity prioritized over everything else so you can quickly make a chart and move on.
Cross-technology
Use in your Swing, Java EE or Java SE applications.
License
Apache 2.0 open source license means you can use it worry-free in your personal and commercial projects.