 The Bro Network Security Monitor is an open source network monitoring framework. In a nutshell, Bro monitors packet flows over a network with a network tap installed with optional bonded network interfaces, and creates high-level “flow” events from them and stores the events as single tab-separated lines in a log file. You can then parse these log files to data mine for information about the network traffic on the network you are monitoring. These logs include not only a comprehensive record of every connection seen on the wire, but also application-layer transcripts such as all HTTP sessions with their requested URIs, key headers, MIME types, server responses, DNS requests with replies, SSL certificates, key content of SMTP sessions, and much more. For more information about Bro itself, read their extensive documentation.
Install the Dependencies
Bro needs a few dependencies the following command will install them.
|
1 2 |
sudo apt-get install cmake make gcc g++ flex bison libpcap-dev libgeoip-dev libssl-dev python-dev zlib1g-dev libmagic-dev swig libgoogle-perftools-dev |
Create Bro Directory
Create the directory where Bro will be installed and it writes its logs.
|
1 2 |
sudo mkdir -p /nsm/bro |
Install Bro
Bro is installed by downloading the current source code and building it with the make command. Make sure to check Bro’s download page to get the latest release version and adapt the following code accordingly.
|
1 2 3 4 5 6 7 8 9 |
cd ~ wget https://www.bro.org/downloads/release/bro-2.4.1.tar.gz tar -xvzf bro-2.4.1.tar.gz cd bro-2.4.1 ./configure --prefix=/nsm/bro make sudo make install export PATH=/nsm/bro/bin:$PATH |
Configure Bro
First, tell Bro which network interface to monitor (i.e. interface=br0).
|
1 2 |
sudo nano /nsm/bro/etc/node.cfg |
Then, tell Bro which private IP range to monitor.
|
1 2 |
sudo nano /nsm/bro/etc/networks.cfg |
Finally, change the MailTo address and the logging config.
|
1 2 |
sudo nano /nsm/bro/etc/broctl.cfg |
Start Bro
BroControl is used to start Bro. First, it needs to be installed.
|
1 2 3 4 |
sudo /nsm/bro/bin/broctl install exit |
Then, run the start command on system startup by adding /nsm/bro/bin/broctl start to /etc/rc.local
|
1 2 |
sudo nano /etc/rc.local # add: /nsm/bro/bin/broctl start |
Add a cron job which performs maintenance tasks for bro.
|
1 2 |
crontab -e # add: 0-59/5 * * * * /nsm/bro/bin/broctl cron |
Finally, restart the machine.
|
1 2 |
sudo shutdown -r now |
Test Bro
If all is well, you can tail the conn.log file and observe Bro logs streaming in real time.
|
1 2 |
tail -f /nsm/bro/logs/current/conn.log |
What’s Next?
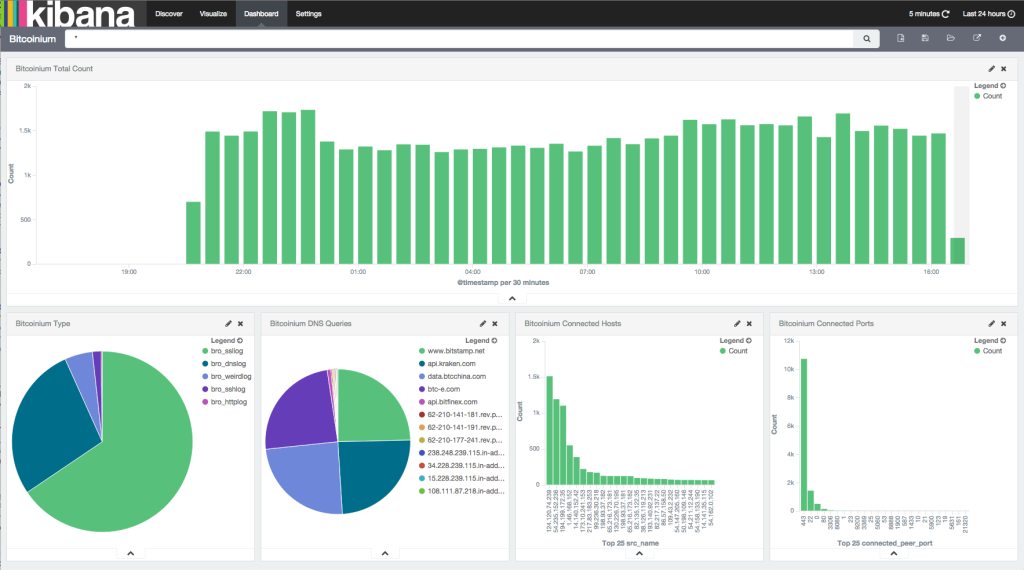
Bro is wonderful at producing network flow data, but reading through log files manually is pretty tedious. One excellent way to visualize and mine the data is with the ELK stack – Elasticsearch, Logstash and Kibana. Bro combined with the ELK stack makes a wonderful combination. If you need help installing the ELK stack and integrating Bro into it, check out How to Set Up the ELK Stack- Elasticsearch, Logstash and Kibana and Integrate Bro IDS with ELK Stack respectively. The following is a screenshot of a Kibana 4 Dashboard that was setup for Bro and the website bitcoinium.com.
Related Resources
Integrating Bro with the ELK Stack: http://knowm.org/integrate-bro-ids-with-elk-stack/
How to Created a Bonded Network Interface: http://knowm.org/how-to-create-a-bonded-network-interface/
How to Set Up the ELK Stack- Elasticsearch, Logstash and Kibana: http://knowm.org/how-to-set-up-the-elk-stack-elasticsearch-logstash-and-kibana







3 Comments
Sujith kawashkar
What is I have a pfsense installed and I have created 30 Vlans and the Pfsense acting as the DHCP source.
1. Now which network should I make Bro to Monitor?
2. Should I make Bro a stand alone system or can i install bro in pfsense itself?
Tim Molter
If you want to monitor all the traffic across all VLANs, then you can tap into the main line going to pfsesne. You probably want to create a stand alone Bro server. Otherwise the server you;re running pfsense on will have to share resources with Bro and that might cause problems. It depends on your particular network and hardware though.
Jody Randall
Very helpful instructions on the setup of bro. With the new version of Bro (2.5.3) they have modified how to launch it. Instead of “broctl start” it has changed to “broctl deploy”. It took a bit for me to realize it and made the change in the /etc/rc.local from ” /nsm/bro/bin/broctl start” to “/nsm/bro/bin/broctl deploy”.