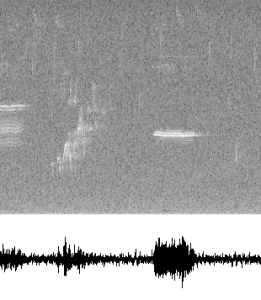
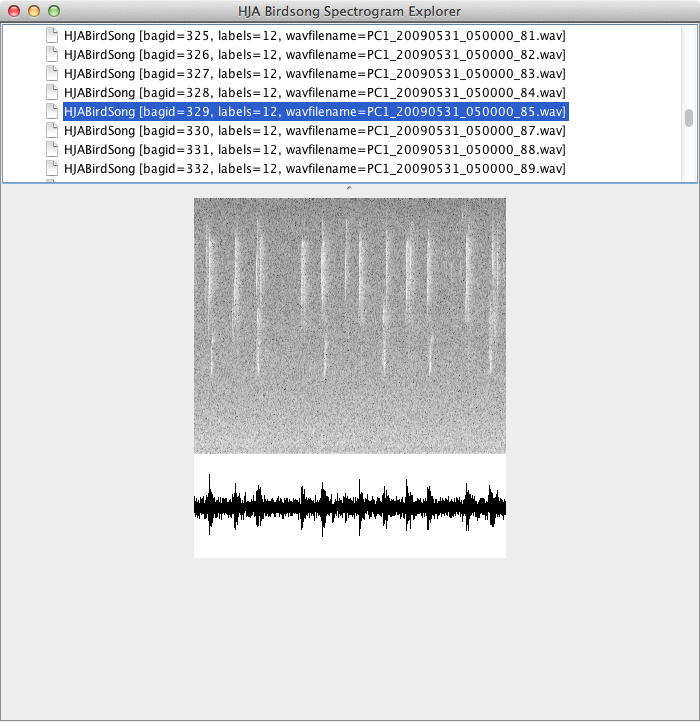
 As part of Xeiam’s Datasets open source project, we’ve built a basic WAV audio file explorer which displays the spectrogram and waveform of ten second audio clips of birdsong from the HJA Birdsong machine learning dataset. Since this project is open source and licensed under the Apache 2.0 license anyone is free to use the code to build their own audio file explorer in Java. In fact, this project was built with components from the musicg project, also licenced under the Apache license. Spectrogram and waveform analysis can be used in machine learning as a preprocessing step in designing feature encoders for downstream neural networks.
How to read a WAV file in Java
According to this wave soundfile format description, a wav file is a binary file, where the first 44 bytes contain meta data and formatting type for the actual audio data. The audio data follows the meta data. In our Wave class, we pass an InputStream to the constructor and the header and data are parsed as follows.
|
1 2 3 4 5 6 |
// reads the first 44 bytes for header waveHeader = new WaveHeader(inputStream); // load data data = new byte[inputStream.available()]; inputStream.read(data); |
The header meta data can be printed out by calling System.out.println(wave.toString());, and the result looks like this:
|
1 2 3 4 5 6 7 8 9 10 11 12 13 14 |
chunkId: RIFF chunkSize: 320044 format: WAVE subChunk1Id: fmt subChunk1Size: 16 audioFormat: 1 channels: 1 sampleRate: 16000 byteRate: 32000 blockAlign: 2 bitsPerSample: 16 subChunk2Id: data subChunk2Size: 320000 length: 10.0 s |
How to Create a Spectrogram in Java
For each input audio file, a Hamming window is first applied to each frame. A FFT is then applied using org.apache.commons.math3.transform.FastFourierTransformer with a window size of 512, transforming the signal into a time-frequency spectrogram. A filter is subsequently applied to the spectrogram, to normalize the levels of the signal. The resulting frequency range of the FFT analysis is from 0 to 8 kHz given the sampling frequency of 16 kHz of these particular audio files. The following code is an excerpt from the class Spectrogram.java and shows the steps for the spectrogram creation.
|
1 2 3 4 5 6 7 8 9 10 11 12 13 14 15 16 17 18 19 20 21 22 23 24 25 26 27 28 29 30 31 32 33 34 35 36 37 38 39 40 41 42 43 44 45 46 47 48 49 50 51 52 53 54 55 56 57 58 59 60 61 62 63 64 65 66 67 68 69 70 71 72 73 74 75 76 77 78 79 80 81 82 83 84 85 86 87 88 89 90 91 92 93 94 |
private void buildSpectrogram() { short[] amplitudes = wave.getSampleAmplitudes(); int numSamples = amplitudes.length; int pointer = 0; // overlapping if (overlapFactor > 1) { int numOverlappedSamples = numSamples * overlapFactor; int backSamples = fftSampleSize * (overlapFactor - 1) / overlapFactor; int fftSampleSize_1 = fftSampleSize - 1; short[] overlapAmp = new short[numOverlappedSamples]; pointer = 0; for (int i = 0; i < amplitudes.length; i++) { overlapAmp[pointer++] = amplitudes[i]; if (pointer % fftSampleSize == fftSampleSize_1) { // overlap i -= backSamples; } } numSamples = numOverlappedSamples; amplitudes = overlapAmp; } numFrames = numSamples / fftSampleSize; framesPerSecond = (int) (numFrames / wave.getLengthInSeconds()); // set signals for fft WindowFunction window = new WindowFunction(); double[] win = window.generate(WindowType.HAMMING, fftSampleSize); double[][] signals = new double[numFrames][]; for (int f = 0; f < numFrames; f++) { signals[f] = new double[fftSampleSize]; int startSample = f * fftSampleSize; for (int n = 0; n < fftSampleSize; n++) { signals[f][n] = amplitudes[startSample + n] * win[n]; } } absoluteSpectrogram = new double[numFrames][]; // for each frame in signals, do fft on it FastFourierTransform fft = new FastFourierTransform(); for (int i = 0; i < numFrames; i++) { absoluteSpectrogram[i] = fft.getMagnitudes(signals[i]); } if (absoluteSpectrogram.length > 0) { numFrequencyUnit = absoluteSpectrogram[0].length; frequencyBinSize = (double) wave.getWaveHeader().getSampleRate() / 2 / numFrequencyUnit; // frequency could be caught within the half of // nSamples according to Nyquist theory frequencyRange = wave.getWaveHeader().getSampleRate() / 2; // normalization of absoultSpectrogram spectrogram = new double[numFrames][numFrequencyUnit]; // set max and min amplitudes double maxAmp = Double.MIN_VALUE; double minAmp = Double.MAX_VALUE; for (int i = 0; i < numFrames; i++) { for (int j = 0; j < numFrequencyUnit; j++) { if (absoluteSpectrogram[i][j] > maxAmp) { maxAmp = absoluteSpectrogram[i][j]; } else if (absoluteSpectrogram[i][j] < minAmp) { minAmp = absoluteSpectrogram[i][j]; } } } // normalization // avoiding divided by zero double minValidAmp = 0.00000000001F; if (minAmp == 0) { minAmp = minValidAmp; } double diff = Math.log10(maxAmp / minAmp); // perceptual difference for (int i = 0; i < numFrames; i++) { for (int j = 0; j < numFrequencyUnit; j++) { if (absoluteSpectrogram[i][j] < minValidAmp) { spectrogram[i][j] = 0; } else { spectrogram[i][j] = (Math.log10(absoluteSpectrogram[i][j] / minAmp)) / diff; // System.out.println(spectrogram[i][j]); } } } } } |
Exploring the HJA Birdsong Dataset
The HJA Birdsong dataset from Oregon State University contains 548 ten-second audio clips of birdsong from 13 different bird species. To create a classifier for this machine learning dataset, we first parsed the audio data and built a visual explorer for each WAV file using the above code in order to get a sense of what the data look like.
Each birdsong recording clearly displays the bird songs and each species clearly has its own spectrogram “fingerprint”.
Closing Remarks
Feel free to use the HJA Birdsong spectrogram explorer yourself as a way to learn how to parse WAV files in Java and/or to create a spectrogram. You can also use our hja-birdsong module to jump start your own bird song classifer. All you need to do is donwload or build the jar your self and start playing around with the data. More information can be found in the module’s README file.







Leave a Comment