Using QuickChart
|
1 2 3 4 5 6 7 8 9 10 11 12 13 14 15 16 17 18 |
/** * Creates a simple Chart using QuickChart */ public class Example0 { public static void main(String[] args) throws Exception { double[] xData = new double[] { 0.0, 1.0, 2.0 }; double[] yData = new double[] { 2.0, 1.0, 0.0 }; // Create Chart XYChart chart = QuickChart.getChart("Sample Chart", "X", "Y", "y(x)", xData, yData); // Show it new SwingWrapper(chart).displayChart(); } } |
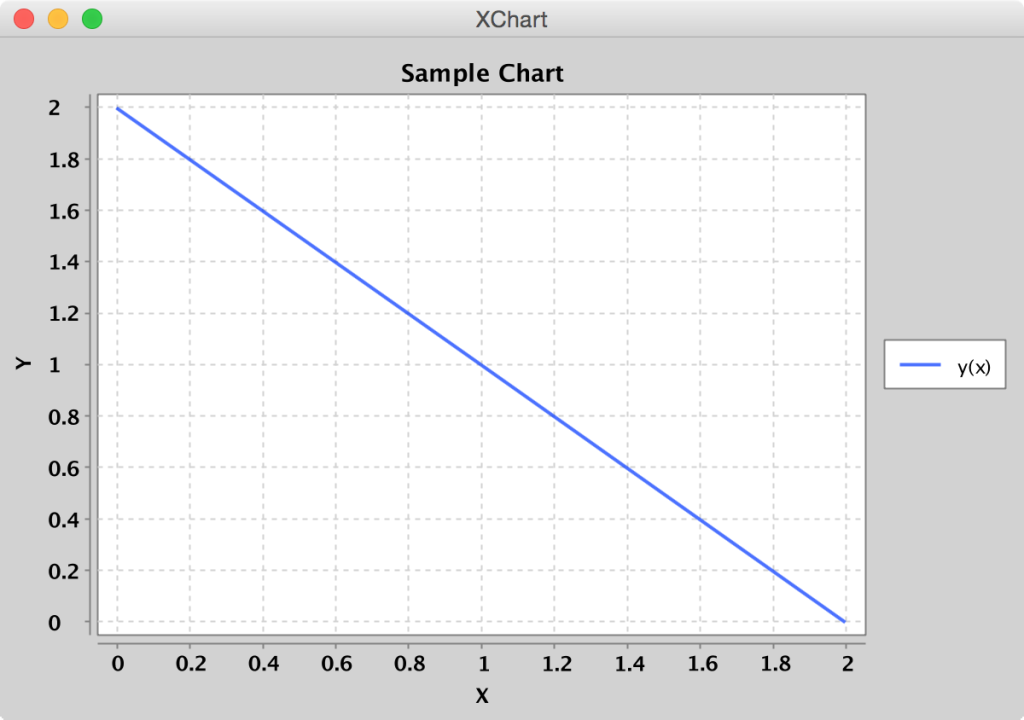
XChart QuickChart
Save Chart as Bitmap
|
1 2 3 4 5 6 7 8 9 10 11 12 13 14 15 16 17 18 19 20 21 22 23 24 25 26 27 28 29 30 31 32 33 |
/** * Creates a simple Chart and saves it as a PNG and JPEG image file. */ public class Example1 { public static void main(String[] args) throws Exception { double[] yData = new double[] { 2.0, 1.0, 0.0 }; // Create Chart XYChart chart = new XYChart(500, 400); chart.setTitle("Sample Chart"); chart.setXAxisTitle("X"); chart.setXAxisTitle("Y"); XYSeries series = chart.addSeries("y(x)", null, yData); series.setMarker(SeriesMarkers.CIRCLE); BitmapEncoder.saveBitmap(chart, "./Sample_Chart", BitmapFormat.PNG); BitmapEncoder.saveBitmap(chart, "./Sample_Chart", BitmapFormat.JPG); BitmapEncoder.saveJPGWithQuality(chart, "./Sample_Chart_With_Quality.jpg", 0.95f); BitmapEncoder.saveBitmap(chart, "./Sample_Chart", BitmapFormat.BMP); BitmapEncoder.saveBitmap(chart, "./Sample_Chart", BitmapFormat.GIF); BitmapEncoder.saveBitmapWithDPI(chart, "./Sample_Chart_300_DPI", BitmapFormat.PNG, 300); BitmapEncoder.saveBitmapWithDPI(chart, "./Sample_Chart_300_DPI", BitmapFormat.JPG, 300); BitmapEncoder.saveBitmapWithDPI(chart, "./Sample_Chart_300_DPI", BitmapFormat.GIF, 300); VectorGraphicsEncoder.saveVectorGraphic(chart, "./Sample_Chart", VectorGraphicsFormat.EPS); VectorGraphicsEncoder.saveVectorGraphic(chart, "./Sample_Chart", VectorGraphicsFormat.PDF); VectorGraphicsEncoder.saveVectorGraphic(chart, "./Sample_Chart", VectorGraphicsFormat.SVG); } } |
Chart Matrix
|
1 2 3 4 5 6 7 8 9 10 11 12 13 14 15 16 17 18 19 20 21 22 23 24 25 26 27 28 29 30 31 32 33 34 35 36 37 38 39 40 41 |
/** * Create a Chart matrix * * @author timmolter */ public class Example2 { public static void main(String[] args) { int numCharts = 4; List<XYChart> charts = new ArrayList<XYChart>(); for (int i = 0; i < numCharts; i++) { XYChart chart = new XYChartBuilder().xAxisTitle("X").yAxisTitle("Y").width(600).height(400).build(); chart.getStyler().setYAxisMin(-10); chart.getStyler().setYAxisMax(10); XYSeries series = chart.addSeries("" + i, null, getRandomWalk(200)); series.setMarker(SeriesMarkers.NONE); charts.add(chart); } new SwingWrapper<XYChart>(charts).displayChartMatrix(); } /** * Generates a set of random walk data * * @param numPoints * @return */ private static double[] getRandomWalk(int numPoints) { double[] y = new double[numPoints]; y[0] = 0; for (int i = 1; i < y.length; i++) { y[i] = y[i - 1] + Math.random() - .5; } return y; } } |
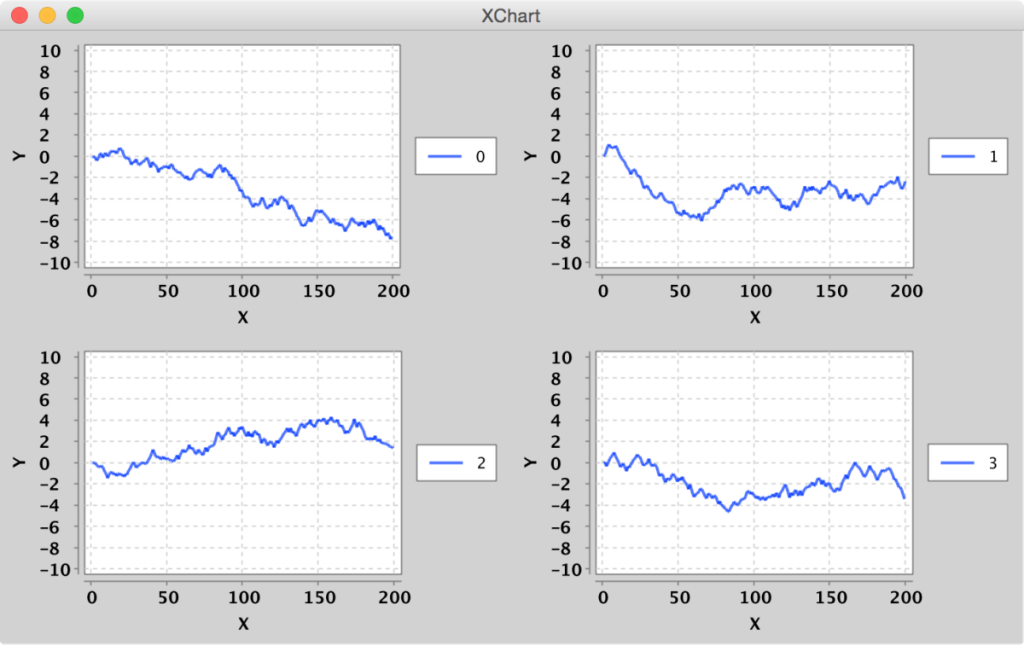
XChart Matrix
Area Chart
|
1 2 3 4 5 6 7 8 9 10 11 12 13 14 15 16 17 18 19 20 21 22 23 24 25 26 27 28 29 30 31 32 33 34 35 36 37 38 |
/** * Area Chart with 3 series * * Demonstrates the following: * <ul> * <li>Area Chart * <li>Place legend at Inside-NE position * <li>ChartBuilder */ public class AreaChart01 implements ExampleChart<XYChart> { public static void main(String[] args) { ExampleChart<XYChart> exampleChart = new AreaChart01(); XYChart chart = exampleChart.getChart(); new SwingWrapper<XYChart>(chart).displayChart(); } @Override public XYChart getChart() { // Create Chart XYChart chart = new XYChartBuilder().width(800).height(600).title(getClass().getSimpleName()).xAxisTitle("X").yAxisTitle("Y").build(); // Customize Chart chart.getStyler().setLegendPosition(LegendPosition.InsideNE); chart.getStyler().setAxisTitlesVisible(false); chart.getStyler().setDefaultSeriesRenderStyle(XYSeriesRenderStyle.Area); // Series chart.addSeries("a", new double[] { 0, 3, 5, 7, 9 }, new double[] { -3, 5, 9, 6, 5 }); chart.addSeries("b", new double[] { 0, 2, 4, 6, 9 }, new double[] { -1, 6, 4, 0, 4 }); chart.addSeries("c", new double[] { 0, 1, 3, 8, 9 }, new double[] { -2, -1, 1, 0, 1 }); return chart; } } |
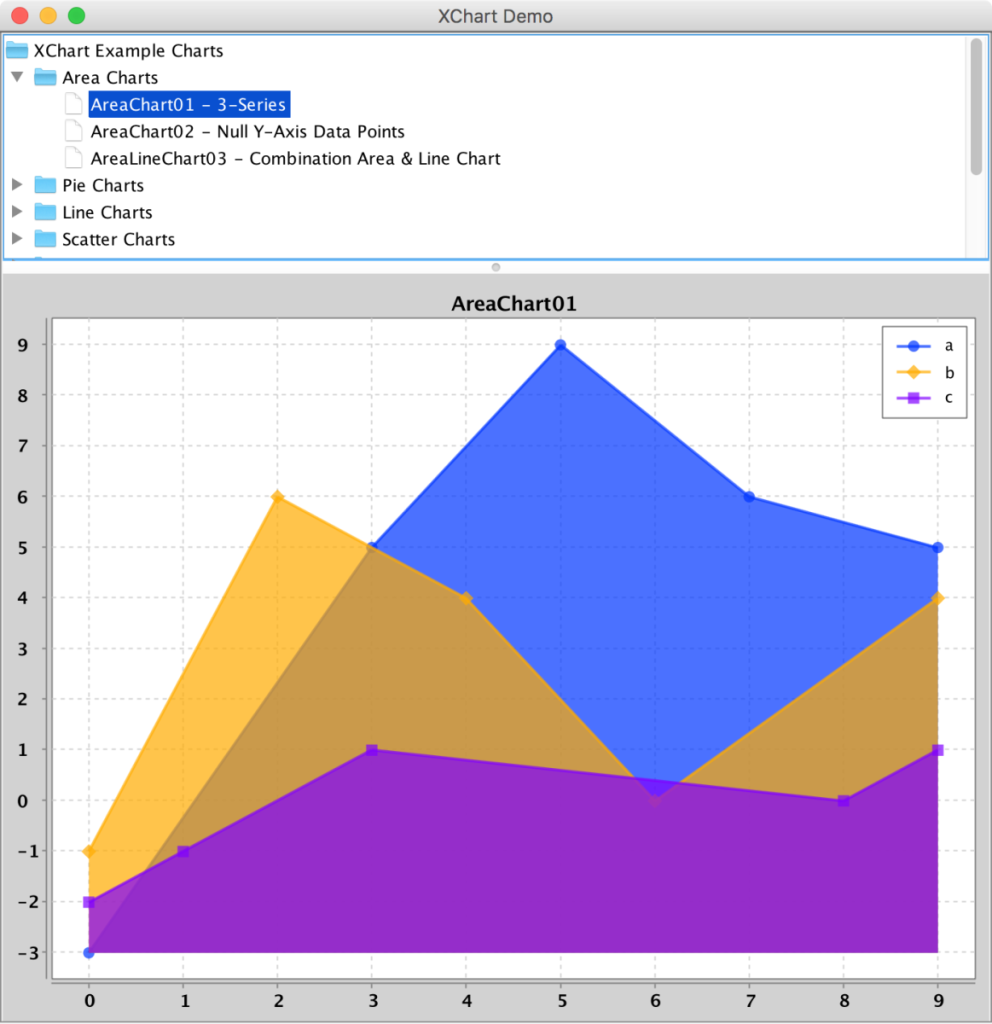
XChart Area Chart
Area and Line Combo
|
1 2 3 4 5 6 7 8 9 10 11 12 13 14 15 16 17 18 19 20 21 22 23 24 25 26 27 28 29 30 31 32 33 34 35 36 37 38 39 40 41 42 43 44 45 46 47 48 49 50 51 52 53 54 55 56 57 58 59 60 61 62 63 64 65 66 67 |
/** * Combination Line & Area Chart * <p/> * Demonstrates the following: * <ul> * <li>Combination of Line and Area series * <li>Axis Label Alignment * <li>Ensuring a chart axis on a tick * <li>Turning off series markers */ public class AreaLineChart03 implements ExampleChart<XYChart> { public static void main(String[] args) { ExampleChart<XYChart> exampleChart = new AreaLineChart03(); XYChart chart = exampleChart.getChart(); new SwingWrapper<XYChart>(chart).displayChart(); } @Override public XYChart getChart() { // Create Chart XYChart chart = new XYChartBuilder().width(800).height(600).title(getClass().getSimpleName()).xAxisTitle("Age").yAxisTitle("Amount").build(); // Customize Chart chart.getStyler().setLegendPosition(LegendPosition.InsideNW); chart.getStyler().setDefaultSeriesRenderStyle(XYSeriesRenderStyle.Line); chart.getStyler().setYAxisLabelAlignment(Styler.TextAlignment.Right); chart.getStyler().setYAxisDecimalPattern("$ #,###.##"); chart.getStyler().setPlotMargin(0); chart.getStyler().setPlotContentSize(.95); // Series // @formatter:off double[] xAges = new double[] { 60, 61, 62, 63, 64, 65, 66, 67, 68, 69, 70, 71, 72, 73, 74, 75, 76, 77, 78, 79, 80, 81, 82, 83, 84, 85, 86, 87, 88, 89, 90, 91, 92, 93, 94, 95, 96, 97, 98, 99, 100 }; double[] yLiability = new double[] { 672234, 691729, 711789, 732431, 753671, 775528, 798018, 821160, 844974, 869478, 907735, 887139, 865486, 843023, 819621, 795398, 770426, 744749, 719011, 693176, 667342, 641609, 616078, 590846, 565385, 540002, 514620, 489380, 465149, 441817, 419513, 398465, 377991, 358784, 340920, 323724, 308114, 293097, 279356, 267008, 254873 }; double[] yPercentile75th = new double[] { 800000, 878736, 945583, 1004209, 1083964, 1156332, 1248041, 1340801, 1440138, 1550005, 1647728, 1705046, 1705032, 1710672, 1700847, 1683418, 1686522, 1674901, 1680456, 1679164, 1668514, 1672860, 1673988, 1646597, 1641842, 1653758, 1636317, 1620725, 1589985, 1586451, 1559507, 1544234, 1529700, 1507496, 1474907, 1422169, 1415079, 1346929, 1311689, 1256114, 1221034 }; double[] yPercentile50th = new double[] { 800000, 835286, 873456, 927048, 969305, 1030749, 1101102, 1171396, 1246486, 1329076, 1424666, 1424173, 1421853, 1397093, 1381882, 1364562, 1360050, 1336885, 1340431, 1312217, 1288274, 1271615, 1262682, 1237287, 1211335, 1191953, 1159689, 1117412, 1078875, 1021020, 974933, 910189, 869154, 798476, 744934, 674501, 609237, 524516, 442234, 343960, 257025 }; double[] yPercentile25th = new double[] { 800000, 791439, 809744, 837020, 871166, 914836, 958257, 1002955, 1054094, 1118934, 1194071, 1185041, 1175401, 1156578, 1132121, 1094879, 1066202, 1054411, 1028619, 987730, 944977, 914929, 880687, 809330, 783318, 739751, 696201, 638242, 565197, 496959, 421280, 358113, 276518, 195571, 109514, 13876, 29, 0, 0, 0, 0 }; // @formatter:on XYSeries seriesLiability = chart.addSeries("Liability", xAges, yLiability); seriesLiability.setChartXYSeriesRenderStyle(XYSeries.XYSeriesRenderStyle.Area); seriesLiability.setMarker(SeriesMarkers.NONE); chart.addSeries("75th Percentile", xAges, yPercentile75th); chart.addSeries("50th Percentile", xAges, yPercentile50th); chart.addSeries("25th Percentile", xAges, yPercentile25th); return chart; } } |
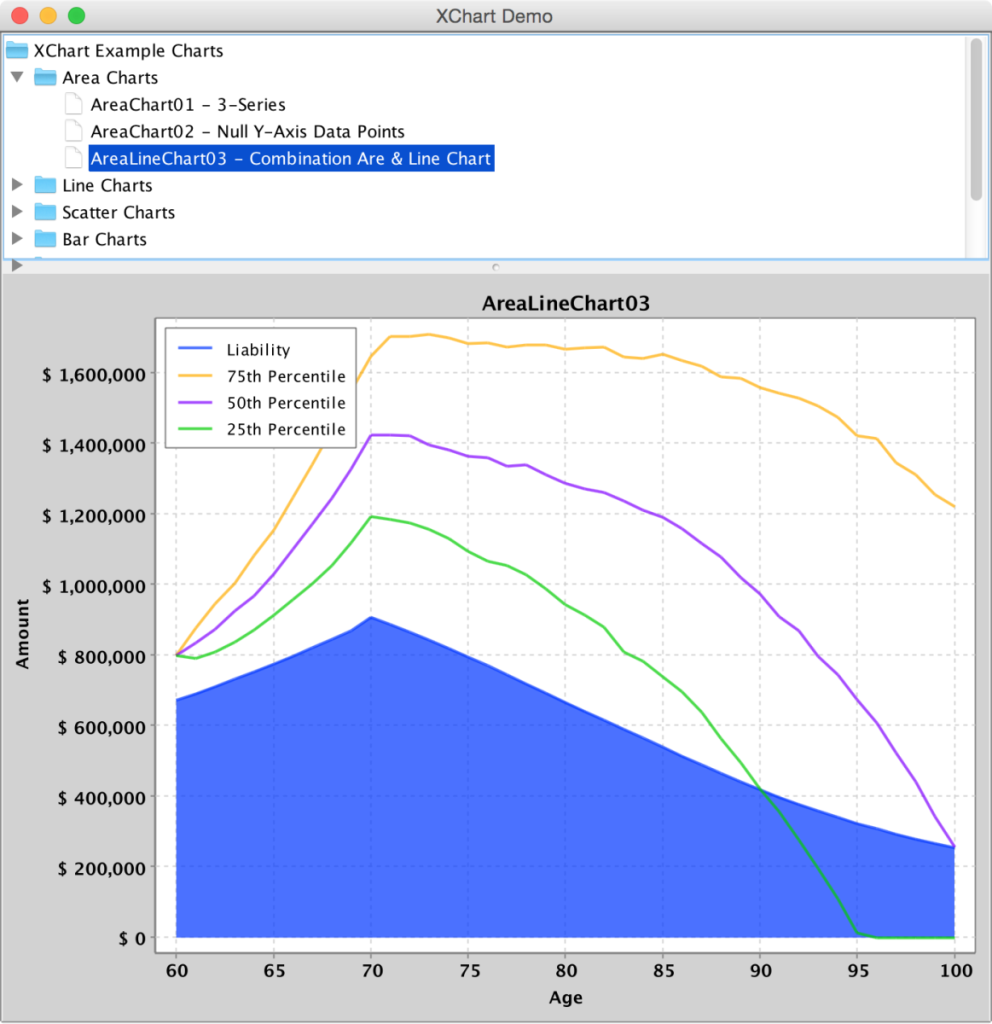
XChart Area and Line Combo
Logarithmic Line Chart
|
1 2 3 4 5 6 7 8 9 10 11 12 13 14 15 16 17 18 19 20 21 22 23 24 25 26 27 28 29 30 31 32 33 34 35 36 37 38 39 40 41 42 43 44 45 46 47 48 |
/** * Logarithmic Y-Axis * * Demonstrates the following: * <ul> * <li>Logarithmic Y-Axis * <li>Building a Chart with ChartBuilder * <li>Place legend at Inside-NW position */ public class LineChart01 implements ExampleChart<XYChart> { public static void main(String[] args) { ExampleChart<XYChart> exampleChart = new LineChart01(); XYChart chart = exampleChart.getChart(); new SwingWrapper<XYChart>(chart).displayChart(); } @Override public XYChart getChart() { // generates Log data List<Integer> xData = new ArrayList<Integer>(); List<Double> yData = new ArrayList<Double>(); for (int i = -3; i <= 3; i++) { xData.add(i); yData.add(Math.pow(10, i)); } // Create Chart XYChart chart = new XYChartBuilder().width(800).height(600).title("Powers of Ten").xAxisTitle("Power").yAxisTitle("Value").build(); // Customize Chart chart.getStyler().setChartTitleVisible(true); chart.getStyler().setLegendPosition(LegendPosition.InsideNW); chart.getStyler().setYAxisLogarithmic(true); chart.getStyler().setXAxisLabelRotation(45); // chart.getStyler().setXAxisLabelAlignment(TextAlignment.Right); // chart.getStyler().setXAxisLabelRotation(90); // chart.getStyler().setXAxisLabelRotation(0); // Series chart.addSeries("10^x", xData, yData); return chart; } } |
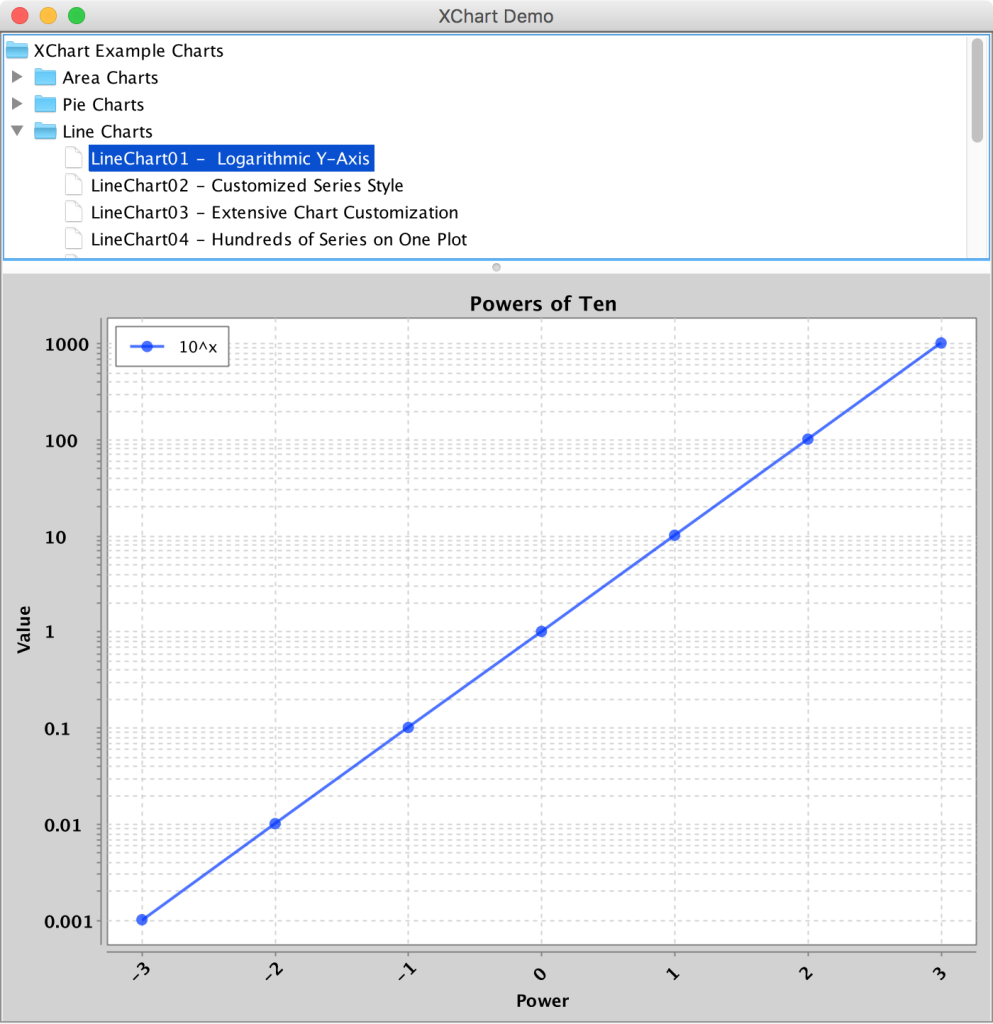
XChart Logarithmic Line Chart
Customized Chart
|
1 2 3 4 5 6 7 8 9 10 11 12 13 14 15 16 17 18 19 20 21 22 23 24 25 26 27 28 29 30 31 32 33 34 35 36 37 38 39 40 41 42 43 44 45 46 47 48 49 50 51 52 53 54 55 56 57 58 59 60 61 62 63 64 65 66 67 68 69 70 71 72 73 74 75 76 77 |
/** * Customized Chart * * Demonstrates the following: * <ul> * <li> * Extensive Chart Customization */ public class LineChart03 implements ExampleChart<XYChart> { public static void main(String[] args) { ExampleChart<XYChart> exampleChart = new LineChart03(); XYChart chart = exampleChart.getChart(); new SwingWrapper<XYChart>(chart).displayChart(); } @Override public XYChart getChart() { // Create Chart XYChart chart = new XYChartBuilder().width(800).height(600).title("LineChart03").xAxisTitle("X").yAxisTitle("Y").build(); // Customize Chart chart.getStyler().setPlotBackgroundColor(ChartColor.getAWTColor(ChartColor.GREY)); chart.getStyler().setPlotGridLinesColor(new Color(255, 255, 255)); chart.getStyler().setChartBackgroundColor(Color.WHITE); chart.getStyler().setLegendBackgroundColor(Color.PINK); chart.getStyler().setChartFontColor(Color.MAGENTA); chart.getStyler().setChartTitleBoxBackgroundColor(new Color(0, 222, 0)); chart.getStyler().setChartTitleBoxVisible(true); chart.getStyler().setChartTitleBoxBorderColor(Color.BLACK); chart.getStyler().setPlotGridLinesVisible(false); chart.getStyler().setAxisTickPadding(20); chart.getStyler().setAxisTickMarkLength(15); chart.getStyler().setPlotMargin(20); chart.getStyler().setChartTitleFont(new Font(Font.MONOSPACED, Font.BOLD, 24)); chart.getStyler().setLegendFont(new Font(Font.SERIF, Font.PLAIN, 18)); chart.getStyler().setLegendPosition(LegendPosition.InsideSE); chart.getStyler().setLegendSeriesLineLength(12); chart.getStyler().setAxisTitleFont(new Font(Font.SANS_SERIF, Font.ITALIC, 18)); chart.getStyler().setAxisTickLabelsFont(new Font(Font.SERIF, Font.PLAIN, 11)); chart.getStyler().setDatePattern("dd-MMM"); chart.getStyler().setDecimalPattern("#0.000"); chart.getStyler().setLocale(Locale.GERMAN); // generates linear data List<Date> xData = new ArrayList<Date>(); List<Double> yData = new ArrayList<Double>(); DateFormat sdf = new SimpleDateFormat("dd.MM.yyyy"); Date date = null; for (int i = 1; i <= 10; i++) { try { date = sdf.parse(i + ".10.2008"); } catch (ParseException e) { e.printStackTrace(); } xData.add(date); yData.add(Math.random() * i); } // Series XYSeries series = chart.addSeries("Fake Data", xData, yData); series.setLineColor(XChartSeriesColors.BLUE); series.setMarkerColor(Color.ORANGE); series.setMarker(SeriesMarkers.CIRCLE); series.setLineStyle(SeriesLines.SOLID); return chart; } } |
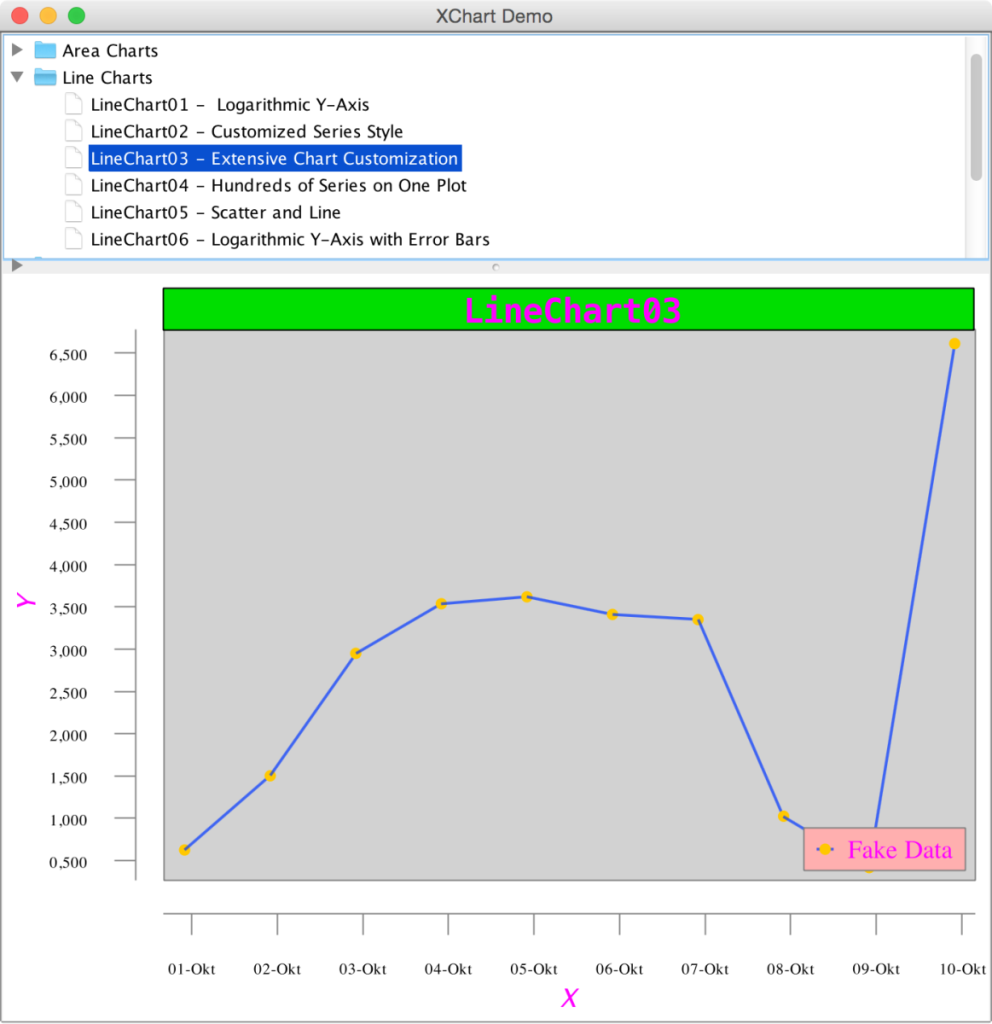
XChart Customized Chart
Pie Chart
|
1 2 3 4 5 6 7 8 9 10 11 12 13 14 15 16 17 18 19 20 21 22 23 24 25 26 27 28 29 30 31 32 33 34 35 36 37 38 39 |
/** * Pie Chart Custom Color Palette * * Demonstrates the following: * <ul> * <li>Pie Chart * <li>ChartBuilderPie * <li>Custom series palette */ public class PieChart02 implements ExampleChart<PieChart> { public static void main(String[] args) { ExampleChart<PieChart> exampleChart = new PieChart02(); PieChart chart = exampleChart.getChart(); new SwingWrapper<PieChart>(chart).displayChart(); } @Override public PieChart getChart() { // Create Chart PieChart chart = new PieChartBuilder().width(800).height(600).title(getClass().getSimpleName()).build(); // Customize Chart Color[] sliceColors = new Color[] { new Color(224, 68, 14), new Color(230, 105, 62), new Color(236, 143, 110), new Color(243, 180, 159), new Color(246, 199, 182) }; chart.getStyler().setSeriesColors(sliceColors); // Series chart.addSeries("Gold", 24); chart.addSeries("Silver", 21); chart.addSeries("Platinum", 39); chart.addSeries("Copper", 17); chart.addSeries("Zinc", 40); return chart; } } |
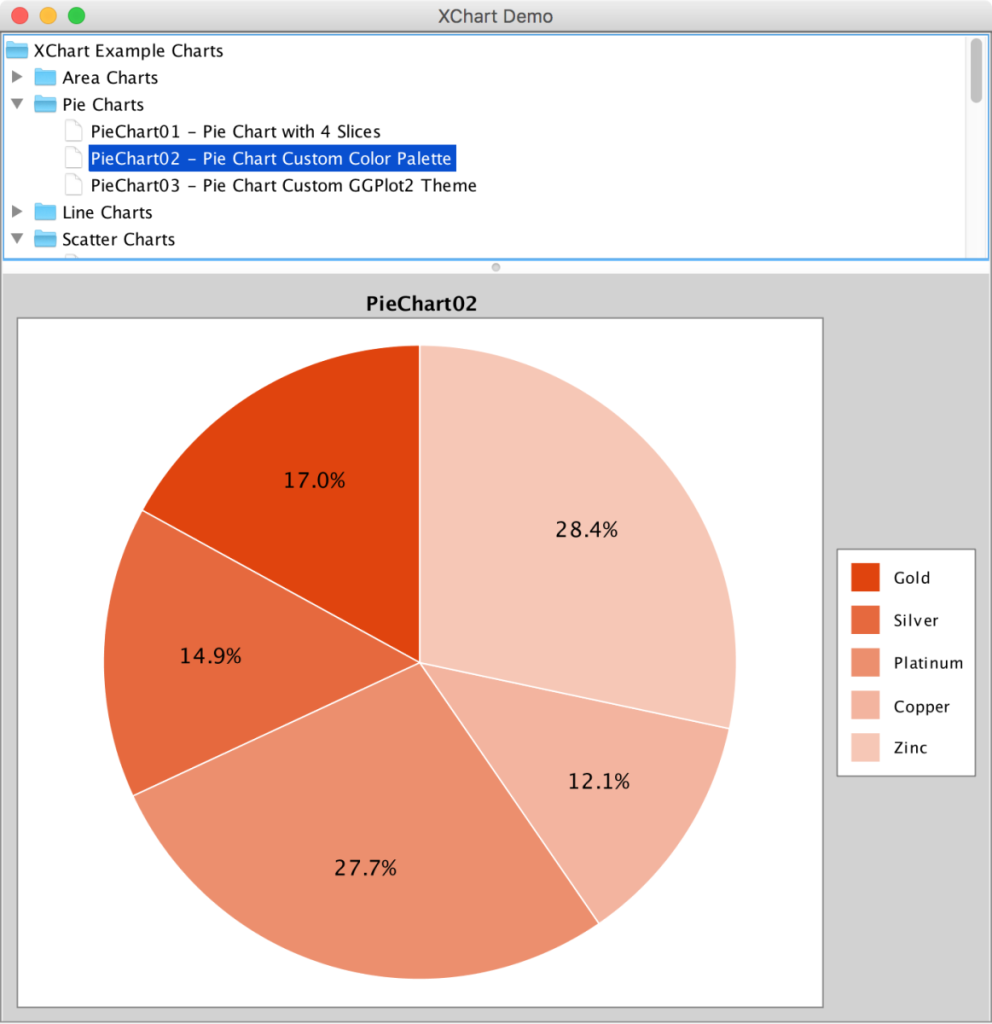
XChart Pie Chart
Stick Chart
|
1 2 3 4 5 6 7 8 9 10 11 12 13 14 15 16 17 18 19 20 21 22 23 24 25 26 27 28 29 30 31 32 33 34 35 36 37 38 39 |
/** * Stick Chart * * Demonstrates the following: * <ul> * <li>Stick category series render type */ public class StickChart01 implements ExampleChart<CategoryChart> { public static void main(String[] args) { ExampleChart<CategoryChart> exampleChart = new StickChart01(); CategoryChart chart = exampleChart.getChart(); new SwingWrapper<CategoryChart>(chart).displayChart(); } @Override public CategoryChart getChart() { // Create Chart CategoryChart chart = new CategoryChartBuilder().width(800).height(600).title("Stick").build(); // Customize Chart chart.getStyler().setChartTitleVisible(true); chart.getStyler().setLegendPosition(LegendPosition.InsideNW); chart.getStyler().setDefaultSeriesRenderStyle(CategorySeriesRenderStyle.Stick); // Series List<Integer> xData = new ArrayList<Integer>(); List<Integer> yData = new ArrayList<Integer>(); for (int i = -3; i <= 24; i++) { xData.add(i); yData.add(i); } chart.addSeries("data", xData, yData); return chart; } } |
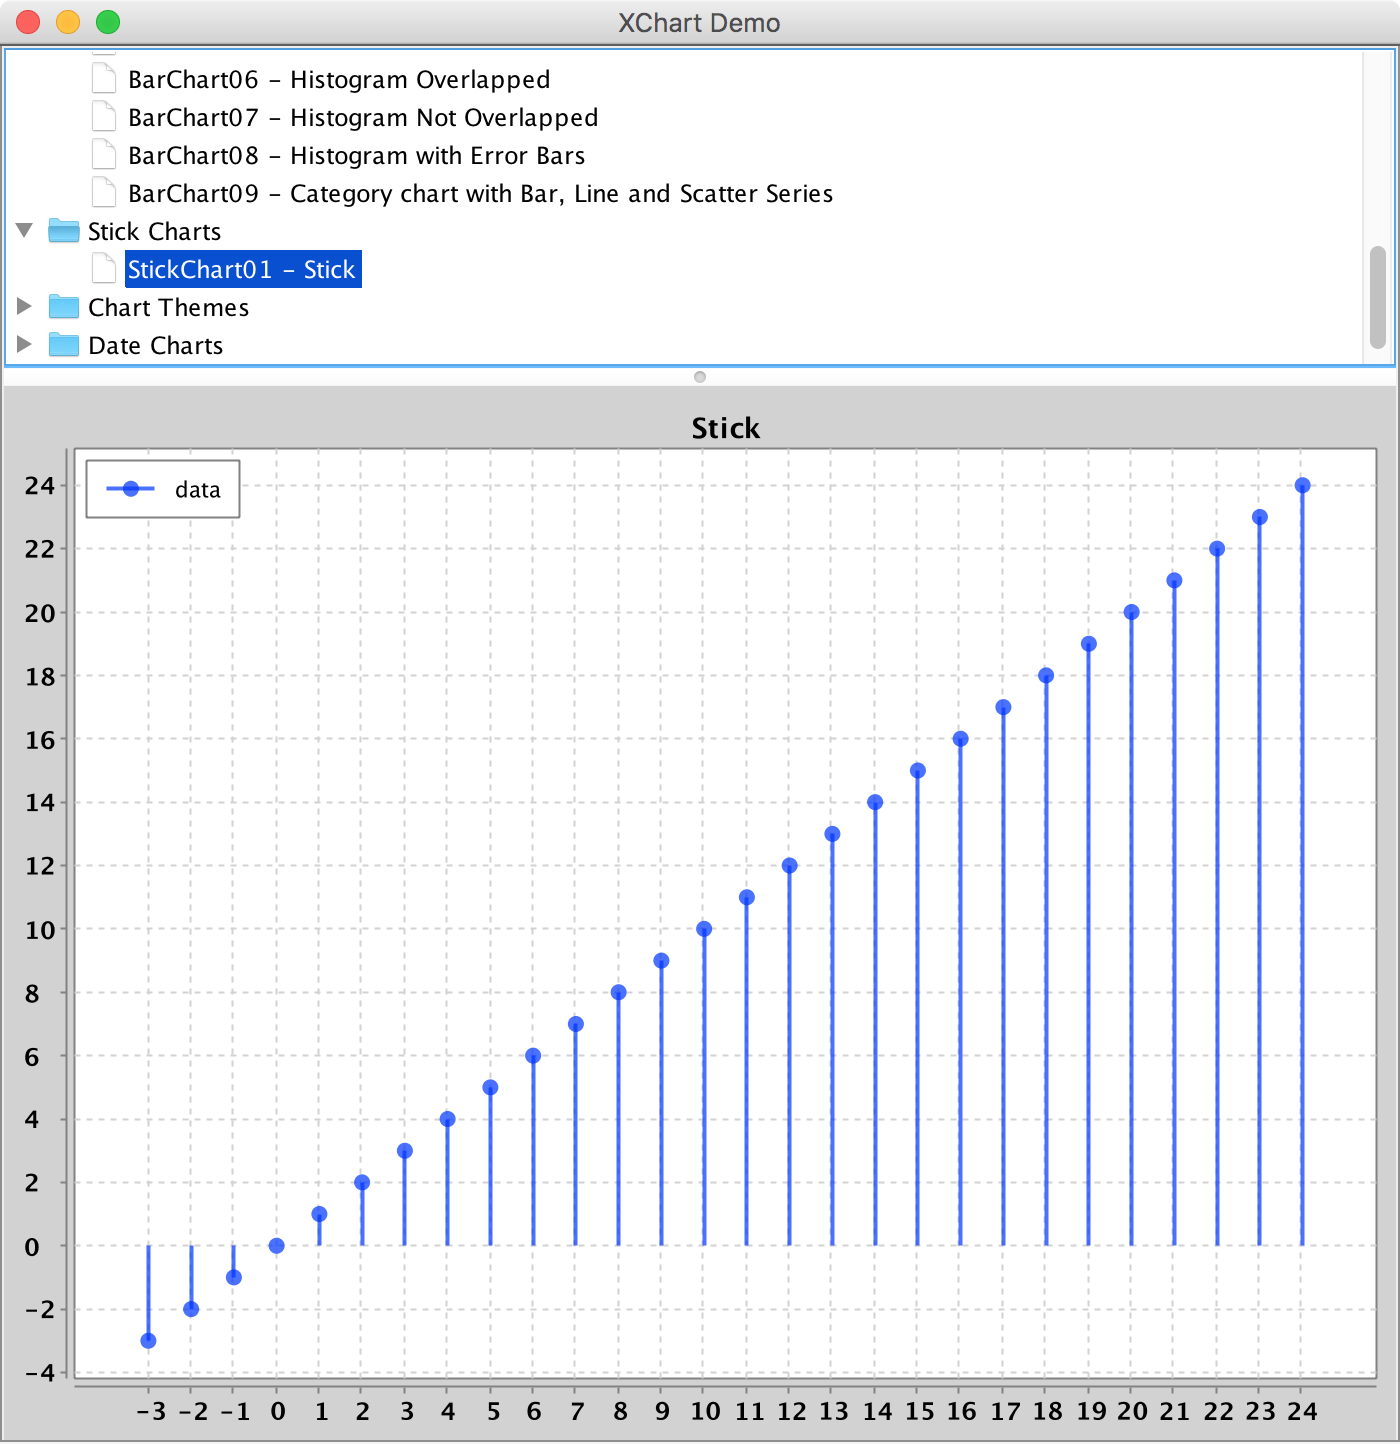
XChart Stick Chart
Scatter
|
1 2 3 4 5 6 7 8 9 10 11 12 13 14 15 16 17 18 19 20 21 22 23 24 25 26 27 28 29 30 31 32 33 34 35 36 37 38 39 40 41 42 43 44 45 46 |
/** * Gaussian Blob * * Demonstrates the following: * <ul> * <li>ChartType.Scatter * <li>Series data as a Set * <li>Setting marker size * <li>Formatting of negative numbers with large magnitude but small differences */ public class ScatterChart01 implements ExampleChart<XYChart> { public static void main(String[] args) { ExampleChart<XYChart> exampleChart = new ScatterChart01(); XYChart chart = exampleChart.getChart(); new SwingWrapper<XYChart>(chart).displayChart(); } @Override public XYChart getChart() { // Create Chart XYChart chart = new XYChartBuilder().width(800).height(600).build(); // Customize Chart chart.getStyler().setDefaultSeriesRenderStyle(XYSeriesRenderStyle.Scatter); chart.getStyler().setChartTitleVisible(false); chart.getStyler().setLegendPosition(LegendPosition.InsideSW); chart.getStyler().setMarkerSize(16); // Series List<Double> xData = new LinkedList<Double>(); List<Double> yData = new LinkedList<Double>(); Random random = new Random(); int size = 1000; for (int i = 0; i < size; i++) { xData.add(random.nextGaussian() / 1000); yData.add(-1000000 + random.nextGaussian()); } chart.addSeries("Gaussian Blob", xData, yData); return chart; } } |
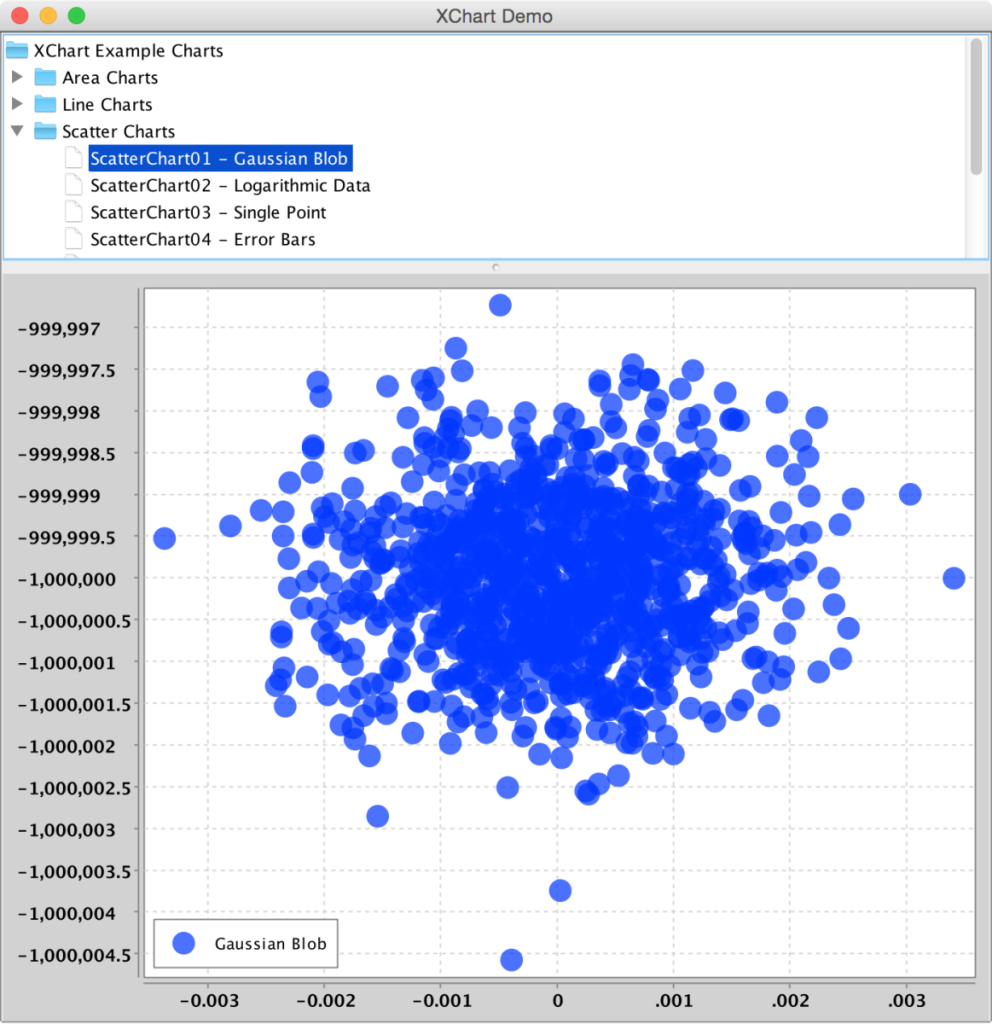
XChart Scatter Chart
Error Bars
|
1 2 3 4 5 6 7 8 9 10 11 12 13 14 15 16 17 18 19 20 21 22 23 24 25 26 27 28 29 30 31 32 33 34 35 36 37 38 39 40 41 42 43 44 45 46 47 48 49 50 51 |
/** * Error Bars * * Demonstrates the following: * <ul> * <li>Error Bars * <li>Using ChartBuilder to Make a Chart * <li>List<Number> data sets * <li>Setting Series Marker and Marker Color * <li>Using a custom decimal pattern */ public class ScatterChart04 implements ExampleChart<XYChart> { public static void main(String[] args) { ExampleChart<XYChart> exampleChart = new ScatterChart04(); XYChart chart = exampleChart.getChart(); new SwingWrapper<XYChart>(chart).displayChart(); } @Override public XYChart getChart() { // Create Chart XYChart chart = new XYChartBuilder().width(800).height(600).title("ScatterChart04").xAxisTitle("X").yAxisTitle("Y").build(); // Customize Chart chart.getStyler().setDefaultSeriesRenderStyle(XYSeriesRenderStyle.Scatter); chart.getStyler().setChartTitleVisible(false); chart.getStyler().setLegendVisible(false); chart.getStyler().setAxisTitlesVisible(false); chart.getStyler().setXAxisDecimalPattern("0.0000000"); // Series int size = 10; List<Double> xData = new ArrayList<Double>(); List<Double> yData = new ArrayList<Double>(); List<Double> errorBars = new ArrayList<Double>(); for (int i = 0; i <= size; i++) { xData.add(((double) i) / 1000000); yData.add(10 * Math.exp(-i)); errorBars.add(Math.random() + .3); } XYSeries series = chart.addSeries("10^(-x)", xData, yData, errorBars); series.setMarkerColor(Color.RED); series.setMarker(SeriesMarkers.SQUARE); return chart; } } |
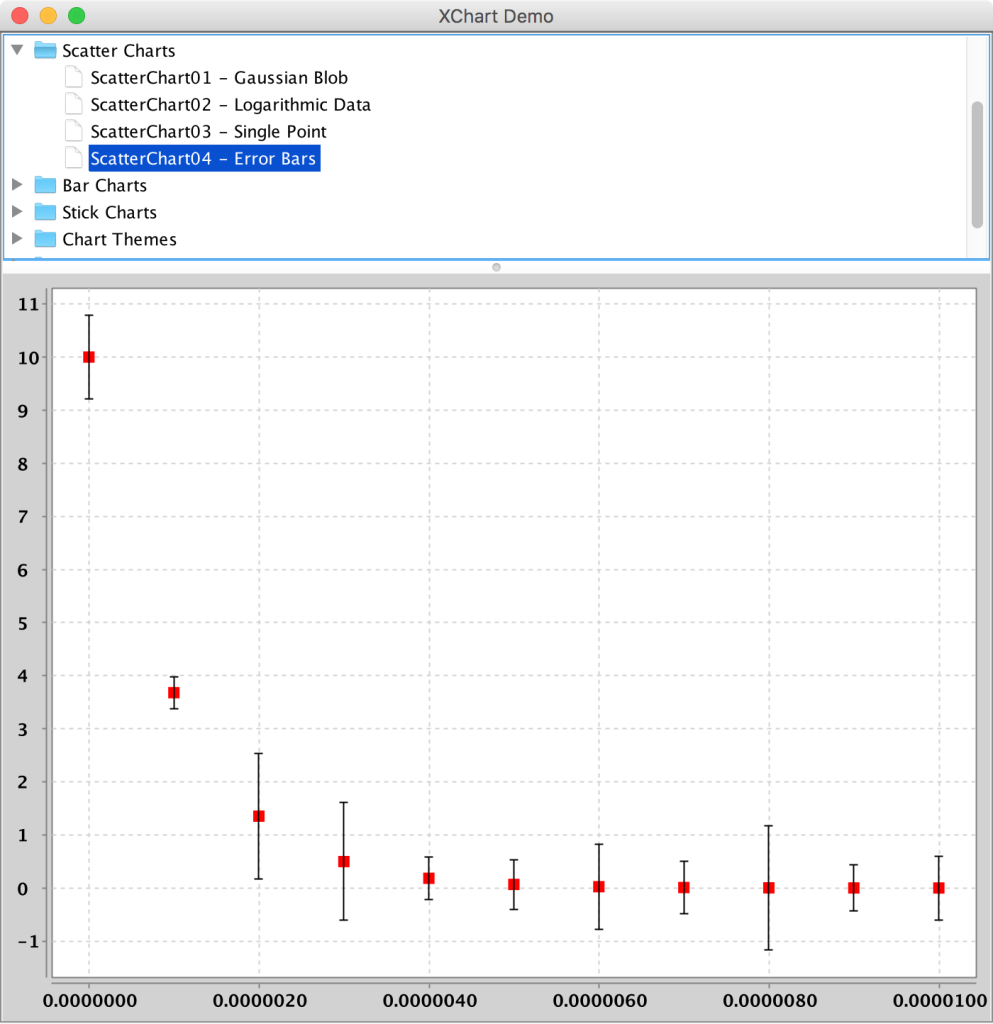
XChart Error Bars
Basic Bar Chart
|
1 2 3 4 5 6 7 8 9 10 11 12 13 14 15 16 17 18 19 20 21 22 23 24 25 26 27 28 29 30 31 32 33 34 35 36 |
/** * Basic Bar Chart * * Demonstrates the following: * <ul> * <li>Integer categories as List * <li>All positive values * <li>Single series * <li>Place legend at Inside-NW position * <li>Bar Chart Annotations */ public class BarChart01 implements ExampleChart<CategoryChart> { public static void main(String[] args) { ExampleChart<CategoryChart> exampleChart = new BarChart01(); CategoryChart chart = exampleChart.getChart(); new SwingWrapper<CategoryChart>(chart).displayChart(); } @Override public CategoryChart getChart() { // Create Chart CategoryChart chart = new CategoryChartBuilder().width(800).height(600).title("Score Histogram").xAxisTitle("Score").yAxisTitle("Number").build(); // Customize Chart chart.getStyler().setLegendPosition(LegendPosition.InsideNW); chart.getStyler().setHasAnnotations(true); // Series chart.addSeries("test 1", Arrays.asList(new Integer[] { 0, 1, 2, 3, 4 }), Arrays.asList(new Integer[] { 4, 5, 9, 6, 5 })); return chart; } } |
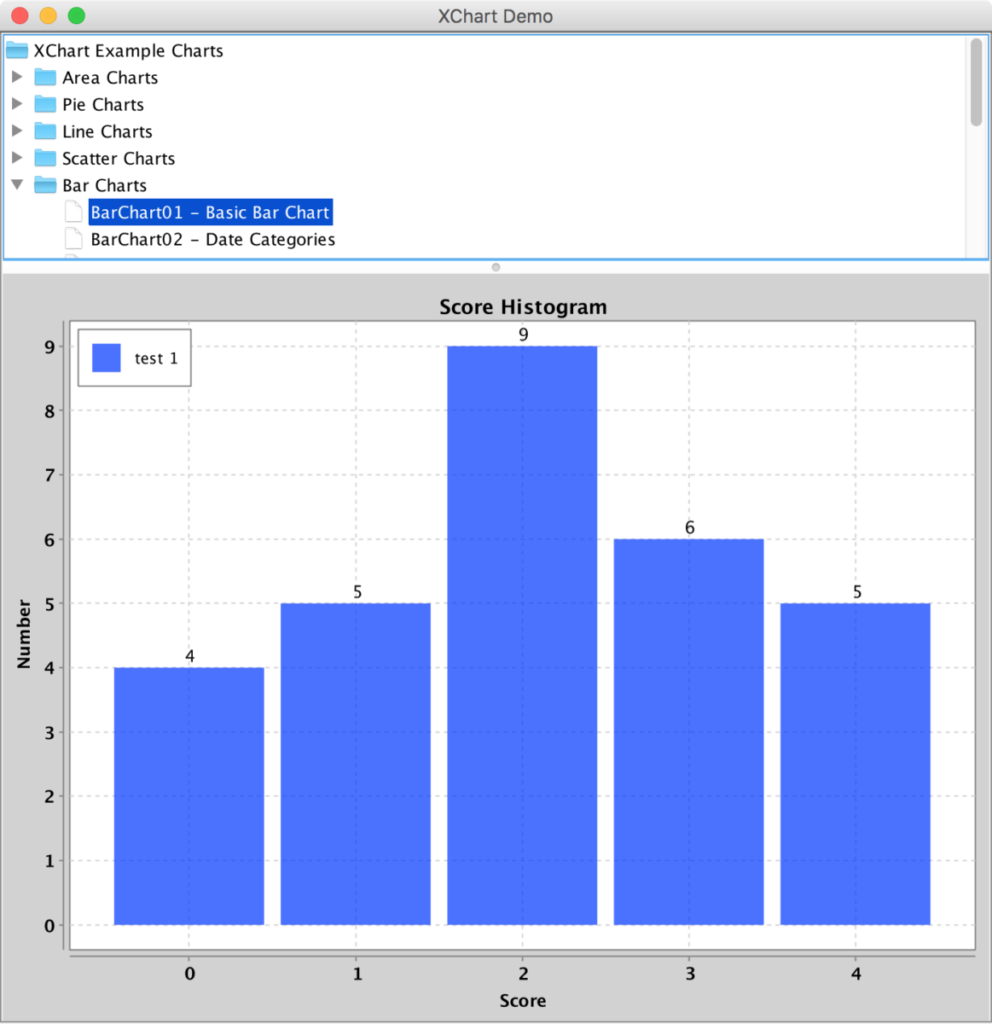
XChart Basic Bar Chart
Histogram Overlapped
|
1 2 3 4 5 6 7 8 9 10 11 12 13 14 15 16 17 18 19 20 21 22 23 24 25 26 27 28 29 30 31 32 33 34 35 36 37 38 39 40 41 42 43 44 45 46 47 48 |
/** * Histogram Overlapped * * Demonstrates the following: * <ul> * <li>Histogram * <li>Bar Chart styles - overlapped, bar width */ public class BarChart06 implements ExampleChart<CategoryChart> { public static void main(String[] args) { ExampleChart<CategoryChart> exampleChart = new BarChart06(); CategoryChart chart = exampleChart.getChart(); new SwingWrapper<CategoryChart>(chart).displayChart(); } @Override public CategoryChart getChart() { // Create Chart CategoryChart chart = new CategoryChartBuilder().width(800).height(600).title("Score Histogram").xAxisTitle("Mean").yAxisTitle("Count").build(); // Customize Chart chart.getStyler().setLegendPosition(LegendPosition.InsideNW); chart.getStyler().setAvailableSpaceFill(.96); chart.getStyler().setOverlapped(true); // Series Histogram histogram1 = new Histogram(getGaussianData(10000), 20, -20, 20); Histogram histogram2 = new Histogram(getGaussianData(5000), 20, -20, 20); chart.addSeries("histogram 1", histogram1.getxAxisData(), histogram1.getyAxisData()); chart.addSeries("histogram 2", histogram2.getxAxisData(), histogram2.getyAxisData()); return chart; } private List<Double> getGaussianData(int count) { List<Double> data = new ArrayList<Double>(count); Random r = new Random(); for (int i = 0; i < count; i++) { data.add(r.nextGaussian() * 10); } return data; } } |
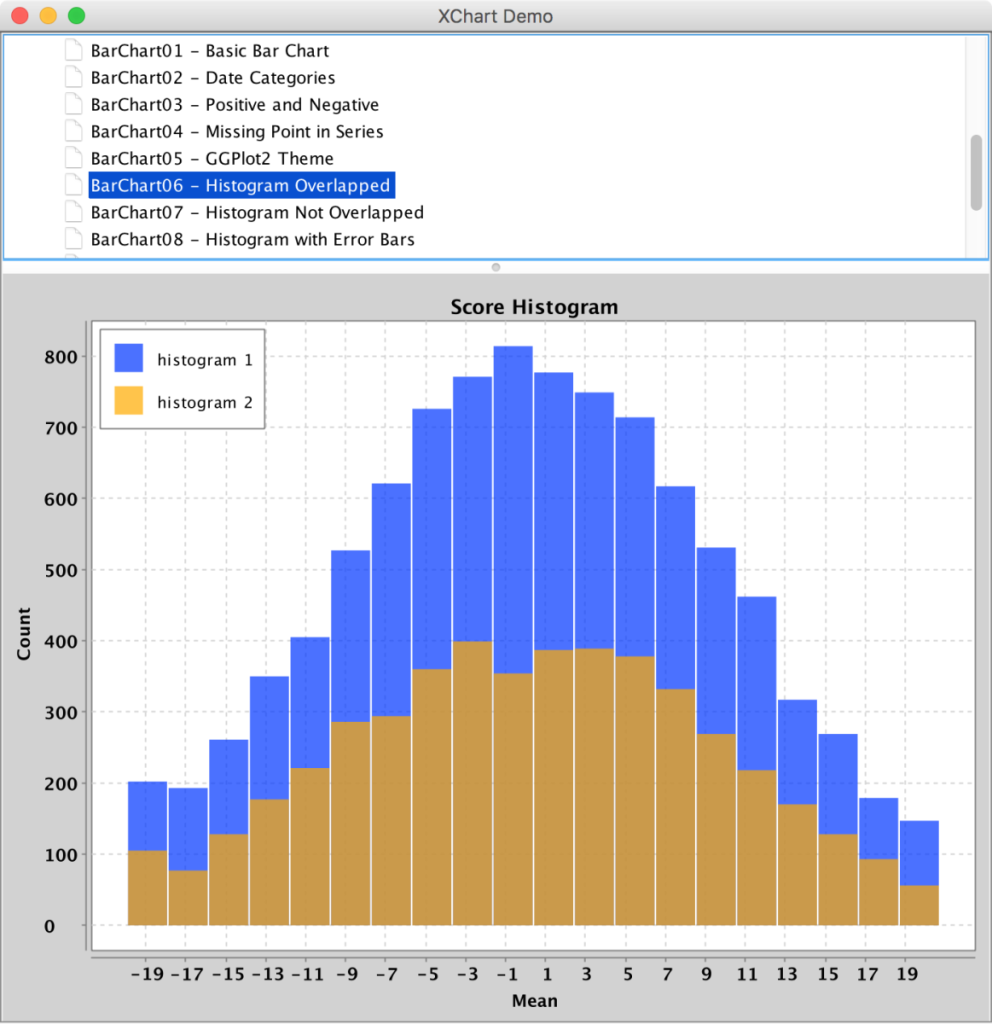
XChart Histogram Overlapped
GGPlot2 Theme
|
1 2 3 4 5 6 7 8 9 10 11 12 13 14 15 16 17 18 19 20 21 22 23 24 25 26 27 28 29 30 31 32 33 34 35 36 37 38 39 40 41 |
/** * GGPlot2 Theme Bar chart * * Demonstrates the following: * <ul> * <li>String categories * <li>Positive and negative values * <li>Multiple series */ public class BarChart05 implements ExampleChart<CategoryChart> { public static void main(String[] args) { ExampleChart<CategoryChart> exampleChart = new BarChart05(); CategoryChart chart = exampleChart.getChart(); new SwingWrapper<CategoryChart>(chart).displayChart(); } @Override public CategoryChart getChart() { // Create Chart CategoryChart chart = new CategoryChartBuilder().width(800).height(600).title("Temperature vs. Color").xAxisTitle("Color").yAxisTitle("Temperature").theme(ChartTheme.GGPlot2).build(); // Customize Chart // Series chart.addSeries("fish", new ArrayList<String>(Arrays.asList(new String[] { "Blue", "Red", "Green", "Yellow", "Orange" })), new ArrayList<Number>(Arrays.asList(new Number[] { -40, 30, 20, 60, 60 }))); chart.addSeries("worms", new ArrayList<String>(Arrays.asList(new String[] { "Blue", "Red", "Green", "Yellow", "Orange" })), new ArrayList<Number>(Arrays.asList(new Number[] { 50, 10, -20, 40, 60 }))); chart.addSeries("birds", new ArrayList<String>(Arrays.asList(new String[] { "Blue", "Red", "Green", "Yellow", "Orange" })), new ArrayList<Number>(Arrays.asList(new Number[] { 13, 22, -23, -34, 37 }))); chart.addSeries("ants", new ArrayList<String>(Arrays.asList(new String[] { "Blue", "Red", "Green", "Yellow", "Orange" })), new ArrayList<Number>(Arrays.asList(new Number[] { 50, 57, -14, -20, 31 }))); chart.addSeries("slugs", new ArrayList<String>(Arrays.asList(new String[] { "Blue", "Red", "Green", "Yellow", "Orange" })), new ArrayList<Number>(Arrays.asList(new Number[] { -2, 29, 49, -16, -43 }))); return chart; } } |
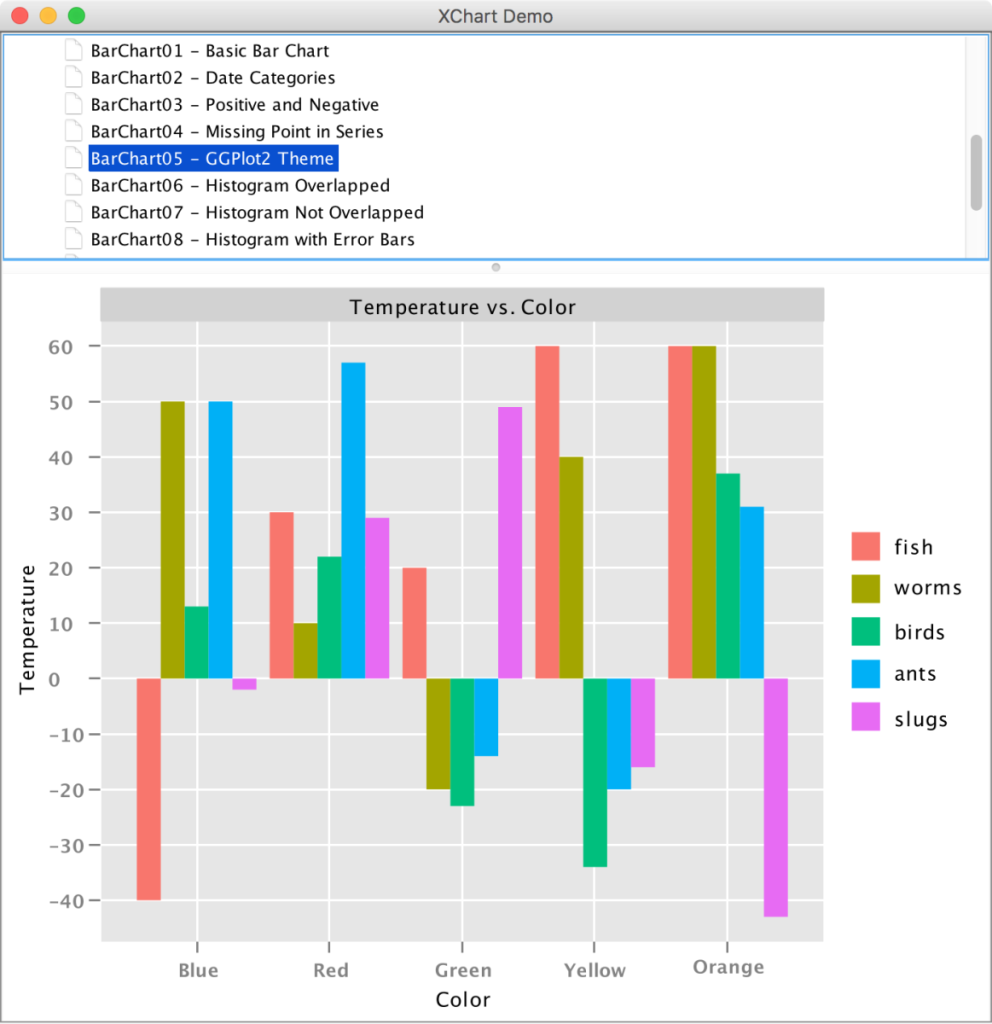
XChart GGPlot2 Theme Bar Chart
MATLAB Theme Chart
|
1 2 3 4 5 6 7 8 9 10 11 12 13 14 15 16 17 18 19 20 21 22 23 24 25 26 27 28 29 30 31 32 33 34 35 36 37 38 39 40 41 42 43 44 45 46 47 48 49 50 51 52 53 54 55 56 57 58 59 60 61 |
/** * Matlab Theme * * Demonstrates the following: * <ul> * <li>Building a Chart with ChartBuilder * <li>Applying the Matlab Theme to the Chart * <li>Generating Gaussian Bell Curve Data */ public class ThemeChart03 implements ExampleChart<XYChart> { public static void main(String[] args) { ExampleChart<XYChart> exampleChart = new ThemeChart03(); XYChart chart = exampleChart.getChart(); new SwingWrapper<XYChart>(chart).displayChart(); } @Override public XYChart getChart() { // Create Chart XYChart chart = new XYChartBuilder().width(800).height(600).theme(ChartTheme.Matlab).title("Matlab Theme").xAxisTitle("X").yAxisTitle("Y").build(); // Customize Chart chart.getStyler().setPlotGridLinesVisible(false); chart.getStyler().setXAxisTickMarkSpacingHint(100); // Series List<Integer> xData = new ArrayList<Integer>(); for (int i = 0; i < 640; i++) { xData.add(i); } List<Double> y1Data = getYAxis(xData, 320, 160); List<Double> y2Data = getYAxis(xData, 320, 320); List<Double> y3Data = new ArrayList<Double>(xData.size()); for (int i = 0; i < 640; i++) { y3Data.add(y1Data.get(i) - y2Data.get(i)); } XYSeries series = chart.addSeries("Gaussian 1", xData, y1Data); series.setMarker(SeriesMarkers.NONE); series = chart.addSeries("Gaussian 2", xData, y2Data); series.setMarker(SeriesMarkers.NONE); series = chart.addSeries("Difference", xData, y3Data); series.setMarker(SeriesMarkers.NONE); return chart; } private List<Double> getYAxis(List<Integer> xData, double mean, double std) { List<Double> yData = new ArrayList<Double>(xData.size()); for (int i = 0; i < xData.size(); i++) { yData.add((1 / (std * Math.sqrt(2 * Math.PI))) * Math.exp(-(((xData.get(i) - mean) * (xData.get(i) - mean)) / ((2 * std * std))))); } return yData; } } |
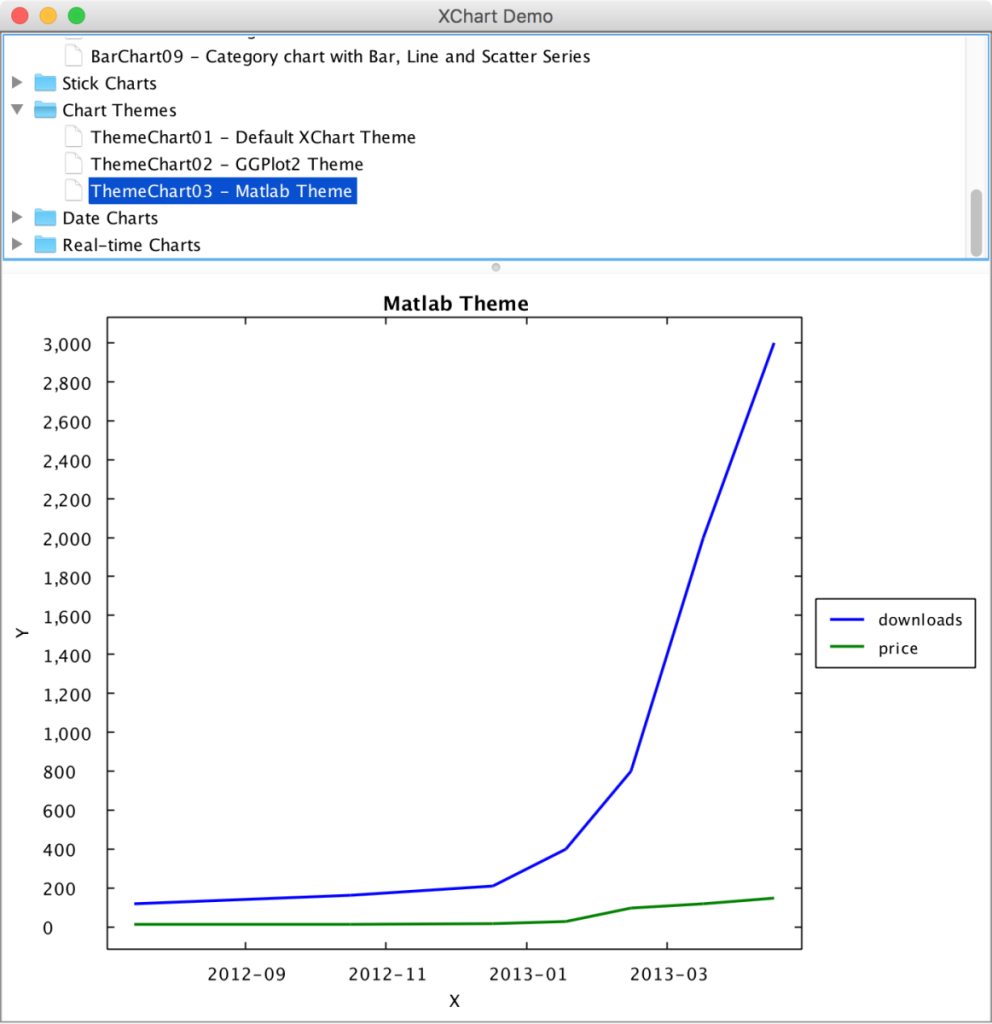
XChart MATLAB Theme Chart
Bubble Chart
|
1 2 3 4 5 6 7 8 9 10 11 12 13 14 15 16 17 18 19 20 21 22 23 24 25 26 27 28 29 30 31 32 33 34 35 36 37 38 39 40 |
/** * Basic Bubble Chart * * Demonstrates the following: * <ul> * <li>Bubble Chart */ public class BubbleChart01 implements ExampleChart<BubbleChart> { public static void main(String[] args) { ExampleChart<BubbleChart> exampleChart = new BubbleChart01(); BubbleChart chart = exampleChart.getChart(); new SwingWrapper<BubbleChart>(chart).displayChart(); } @Override public BubbleChart getChart() { // Create Chart BubbleChart chart = new BubbleChartBuilder().width(800).height(600).title("BubbleChart01").xAxisTitle("X").yAxisTitle("Y").build(); // Customize Chart // Series double[] xData = new double[] { 1.5, 2.6, 3.3, 4.9, 5.5, 6.3, 1, 2.0, 3.0, 4.0, 5, 6 }; double[] yData = new double[] { 10, 4, 7, 7.7, 7, 5.5, 10, 4, 7, 1, 7, 9 }; double[] bubbleData = new double[] { 17, 40, 50, 51, 26, 20, 66, 35, 80, 27, 29, 44 }; double[] xData2 = new double[] { 1, 2.0, 3.0, 4.0, 5, 6, 1.5, 2.6, 3.3, 4.9, 5.5, 6.3 }; double[] yData2 = new double[] { 1, 2, 3, 4, 5, 6, 10, 8.5, 4, 1, 4.7, 9 }; double[] bubbleData2 = new double[] { 37, 35, 80, 27, 29, 44, 57, 40, 50, 33, 26, 20 }; chart.addSeries("A", xData, yData, bubbleData); chart.addSeries("B", xData2, yData2, bubbleData2); return chart; } } |
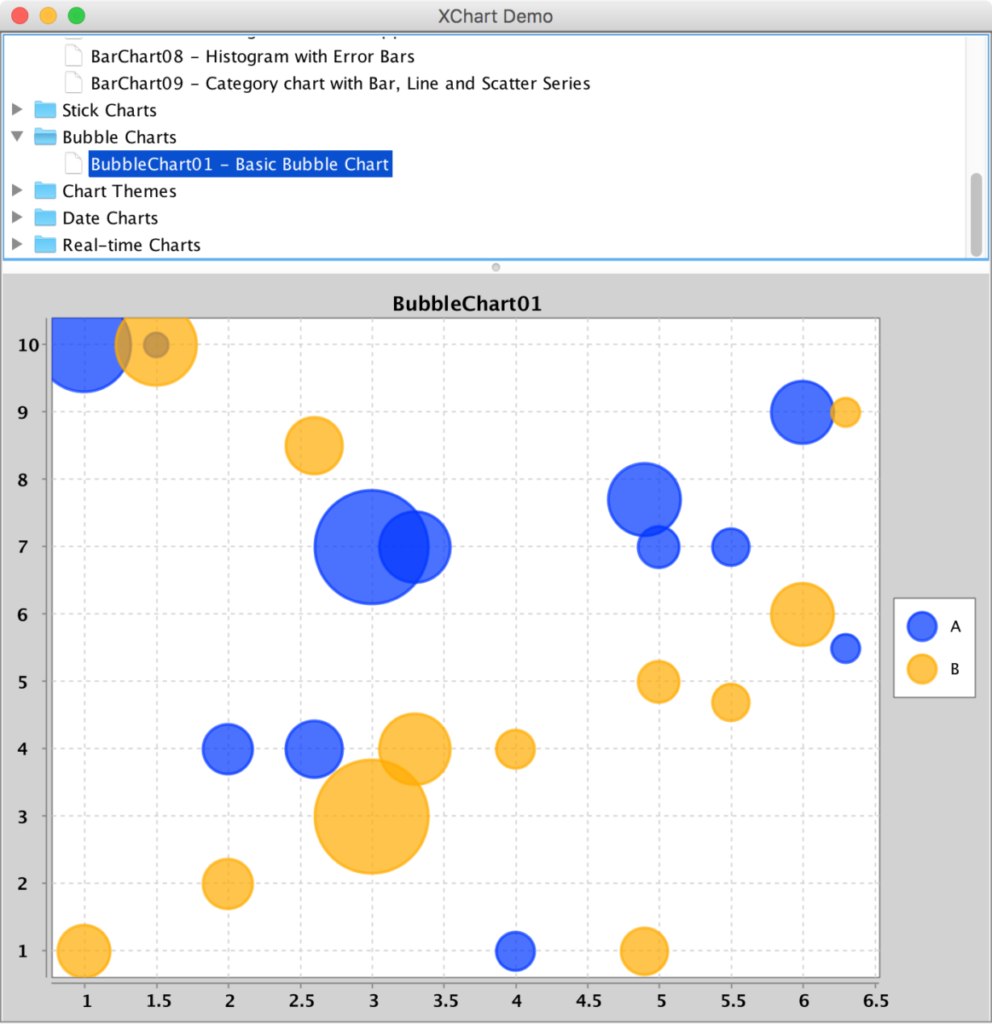
XChart Bubble Chart
Donut Chart
|
1 2 3 4 5 6 7 8 9 10 11 12 13 14 15 16 17 18 19 20 21 22 23 24 25 26 27 28 29 30 31 32 33 34 35 36 37 38 39 40 41 42 43 44 |
/** * Donut Chart * * Demonstrates the following: * <ul> * <li>Donut Chart * <li>PieChartBuilder * <li>XChart Theme */ public class PieChart04 implements ExampleChart<PieChart> { public static void main(String[] args) { ExampleChart<PieChart> exampleChart = new PieChart04(); PieChart chart = exampleChart.getChart(); new SwingWrapper<PieChart>(chart).displayChart(); } @Override public PieChart getChart() { // Create Chart PieChart chart = new PieChartBuilder().width(800).height(600).title(getClass().getSimpleName()).build(); // Customize Chart chart.getStyler().setLegendVisible(false); chart.getStyler().setAnnotationType(AnnotationType.Label); chart.getStyler().setAnnotationDistance(.82); chart.getStyler().setPlotContentSize(.9); chart.getStyler().setDefaultSeriesRenderStyle(PieSeriesRenderStyle.Donut); // chart.getStyler().setCircular(false); // Series chart.addSeries("A", 22); chart.addSeries("B", 10); chart.addSeries("C", 34); chart.addSeries("D", 22); chart.addSeries("E", 29); chart.addSeries("F", 40); return chart; } } |
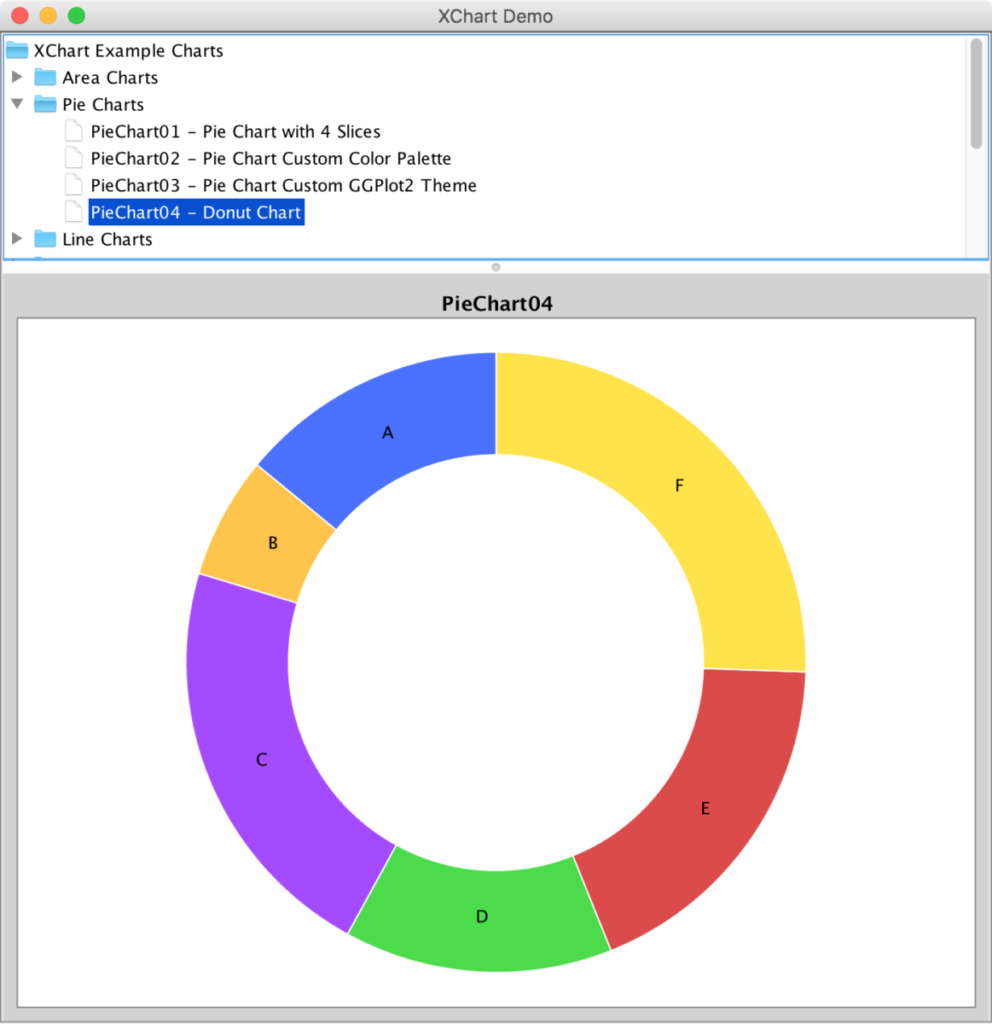
XChart Donut Chart
Real-time Java Chart
|
1 2 3 4 5 6 7 8 9 10 11 12 13 14 15 16 17 18 19 20 21 22 23 24 25 26 27 28 29 30 31 32 33 34 35 36 37 38 39 40 41 42 43 44 45 46 47 48 49 50 51 52 53 54 55 56 57 58 59 60 61 62 63 64 65 66 67 68 69 70 71 72 73 74 75 76 77 78 79 80 81 82 83 84 85 86 87 88 89 90 91 92 93 94 95 96 97 98 99 100 101 102 103 104 105 106 107 108 109 110 111 112 113 114 115 116 117 118 |
/** * Real-time Bubble Chart * * Demonstrates the following: * <ul> * <li>real-time chart updates * <li>multiple series * <li>Bubble chart * <li>GGPlot2 chart */ public class RealtimeChart04 implements ExampleChart<BubbleChart> { private List<Double> yData; private List<Double> bubbleData; public static final String SERIES_NAME = "series1"; public static void main(String[] args) { // Setup the panel final RealtimeChart04 realtimeChart04 = new RealtimeChart04(); final XChartPanel<BubbleChart> chartPanel = realtimeChart04.buildPanel(); // Schedule a job for the event-dispatching thread: // creating and showing this application's GUI. javax.swing.SwingUtilities.invokeLater(new Runnable() { @Override public void run() { // Create and set up the window. JFrame frame = new JFrame("XChart"); frame.setDefaultCloseOperation(JFrame.EXIT_ON_CLOSE); frame.add(chartPanel); // Display the window. frame.pack(); frame.setVisible(true); } }); // Simulate a data feed TimerTask chartUpdaterTask = new TimerTask() { @Override public void run() { realtimeChart04.updateData(); chartPanel.updateSeries(SERIES_NAME, null, realtimeChart04.getyData(), realtimeChart04.getbubbleData()); } }; Timer timer = new Timer(); timer.scheduleAtFixedRate(chartUpdaterTask, 0, 500); } public XChartPanel<BubbleChart> buildPanel() { return new XChartPanel<BubbleChart>(getChart()); } @Override public BubbleChart getChart() { yData = getRandomData(5); bubbleData = getRandomData(5); // Create Chart BubbleChart chart = new BubbleChart(500, 400, ChartTheme.GGPlot2); chart.setTitle("Real-time Bubble Chart"); chart.setXAxisTitle("X"); chart.setYAxisTitle("Y"); chart.addSeries(SERIES_NAME, null, yData, bubbleData); return chart; } private List<Double> getRandomData(int numPoints) { List<Double> data = new CopyOnWriteArrayList<Double>(); for (int i = 0; i < numPoints; i++) { data.add(Math.random() * 100); } return data; } public void updateData() { // Get some new data List<Double> newData = getRandomData(1); yData.addAll(newData); // Limit the total number of points while (yData.size() > 20) { yData.remove(0); } // Get some new data newData = getRandomData(1); bubbleData.addAll(newData); // Limit the total number of points while (bubbleData.size() > 20) { bubbleData.remove(0); } } public List<Double> getyData() { return yData; } public List<Double> getbubbleData() { return bubbleData; } } |
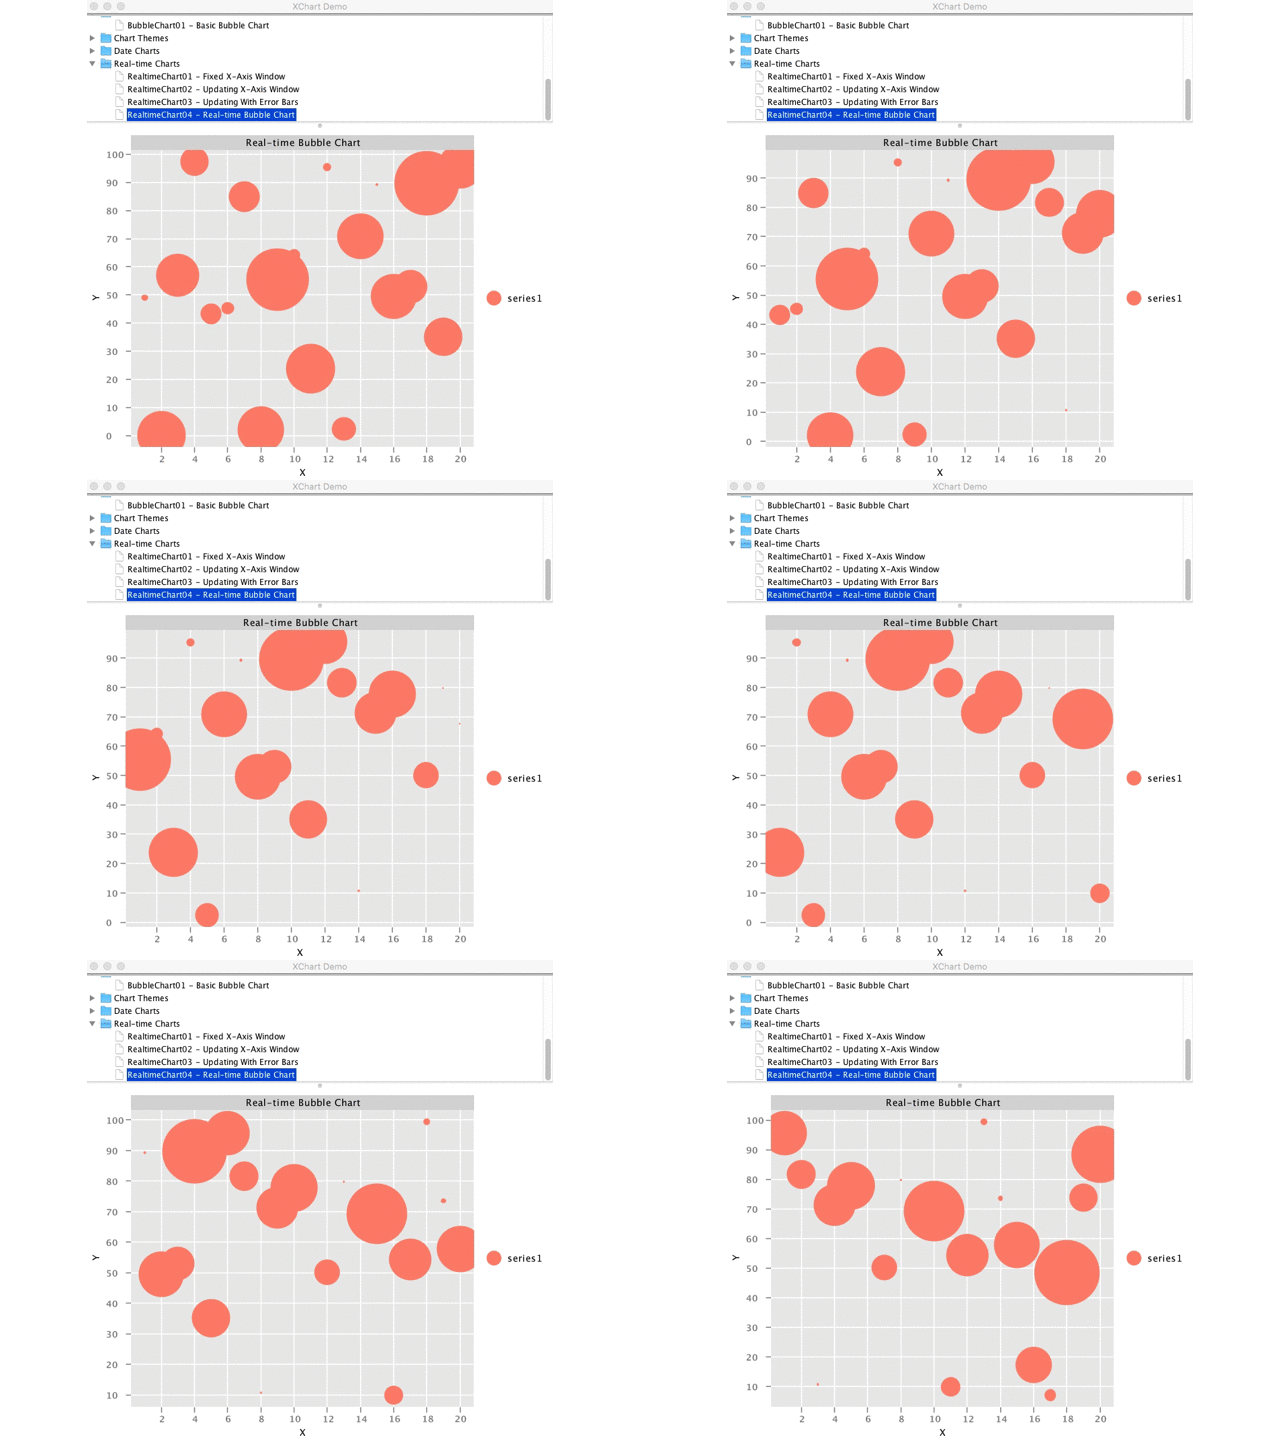
Java XChart Real Time Chart

