Today I’ll be discussing advanced features of the Knowm Open-Source EDA Stack that include extensions to Qucs-S for post-analysis of the M-MSS ( Mean Meta-Stable Switch Memristor Model ) pulse response simulation results we explored in my last post Simulating the Knowm M-MSS Memristor Model Pulse Response with Qucs-S and Xyce. We will further discuss the capabilities of Qucs-S – combining its functionality with Octave – a powerful open-source mathematics-oriented scripting language. With built-in plotting and visualization tools Octave makes it possible to create additional user modules for post-analysis including parameter extraction, advanced numerical computation, custom plotting and data conversion. Octave not only adds full numerical analysis and programming capabilities but also makes available all the features provided by the the many optional Octave Tool Boxes available on Octave-Forge and other open-source repositories. The Octave syntax is largely compatible with MathWorks’ MATLAB and provides capability to integrate additional open-source applications that use the standard Matlab .m script files. In this post I will demonstrate automatic execution of post-simulation data processing scripts provided by Qucs-S along with some additional scripts that I have written to provide extra facilities for handling multi-dimensional simulation results from our Xyce pulse transient analysis for the M-MSS model.
Some of the following text is taken directly from the Qucs-S Help - Ch.6.7.
Many thanks to the Qucs/Qucs-S Development Team for the detailed documentation of the Qucs-S/Octave interface which facilitated the development of the included Octave scripts for this project. I have added common references here and expanded on their instructions where it applies to the context of post-processing the Xyce simulation results we are interested in.
Prerequisites
- Update to the latest
release candidate #2of the Knowm OSS EDA Stack. It is available formacOS 10.12 SierraandUbuntu 16.04 LTS (Xenial Xerus). See instructions for installing Octave for your system in the previous detailed tutorialSimulating the Knowm M-MSS Memristor Model Pulse Response with Qucs-S and Xyce. -
Please complete the exercises in this previous tutorial as we will be using the simulation data files from multiple Xyce transient simulations of the M-MSS model pulse response in this tutorial for extracting and plotting the results.
Launch Qucs-S
- Click on the Qucs app icon on the Launcher Bar.
Using GNU Octave – Scientific Programming Language with Qucs-S GUI
Before introducing the structure and function of the Octave xxxxxx.m file, the simulation post-processing results for the knowm_mr_pulse.sch example are introduced and briefly explained. This allows a number of the basic features required for an Octave .m file to successfully process Qucs-S simulation output data to be listed before presenting the more complex features of individual Octave numerical analysis and plotting functions, to hopefully help all users understand the background and requirements for writing functioning Octave post-processing .m scripts.
Requirements
To use Octave with Qucs-S for output data processing two Qucs-S files are required; firstly a Qucs-S schematic file called xxxxxx.sch, and secondly an Octave script file called xxxxxx.m, where name “xxxxxx” must be identical for both files. By using the same name, Qucs-S assumes that script file xxxxxx.m is to be used to control the post-simulation processing of the output data generated by the simulation of file xxxxxx.sch.
Once the xxxxxx.sch and xxxxxx.m files are entered they can be run by Qucs-S to generate circuit simulation output and undertake output processing with Octave. Qucs-S allows this to be done in two ways; firstly manually controlled by users and secondly automatically controlled by Qucs-S. We will be using the Automatic method below to post-process our simulation results and automatically create our plots.
NOTE: Both methods require users to load the xxxxxx.sch file into the main Qucs-S GUI window before undertaking circuit simulation and output data post-processing. The two general methods are:
Manual method
- Load
xxxxxx.schinto Qucs-GUI window -
Press
F2or selectSimulatebutton on the toolbar.
Run Simulation Toolbar Button
-
Type the name of the
xxxxxx.mfilewithout the .mextension in the Octave Dock command window.
NOTE: If both the xxxxxx.sch and xxxxxx.m files are error free Qucs-S simulates the loaded circuit and undertakes the requested output data post-processing with Octave. Any requested visualization plots are displayed using Qt in new windows superimposed on the Qucs-S GUI
Automatic method
- Load
xxxxxx.schinto Qucs-GUI window -
Press
F2or selectSimulatebutton on the toolbar.Run Simulation Toolbar Button
NOTE: If both the xxxxxx.sch and xxxxxx.m files are error free Qucs-S simulates the loaded circuit and undertakes the requested output data post-processing with Octave. Any requested visualization plots are displayed using Qt in new windows superimposed on the Qucs-S GUI.
Open the KnowmMemristor_prj Examples Project File
- Select the
Projectstab on the left of the Main Dock. -
Double click the
KnowmMemristor_prjto automatically open theContenttab.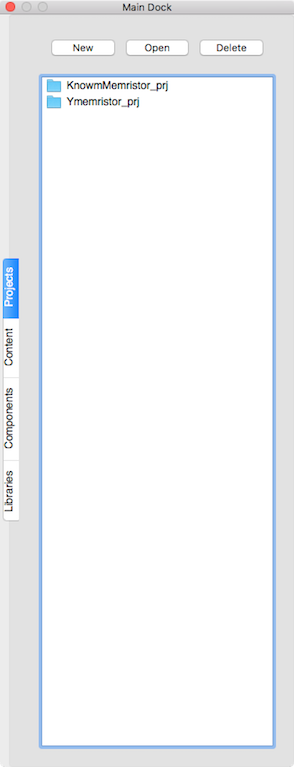
Project List
Select the Schematic diagram
-
Double click on the
knowm_mr_pulse.schfrom theSchematicslist in the Main Dock.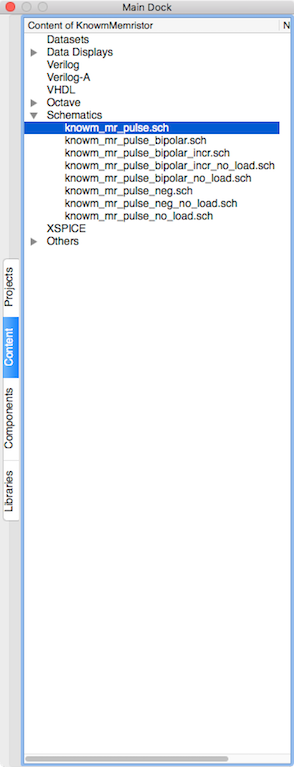
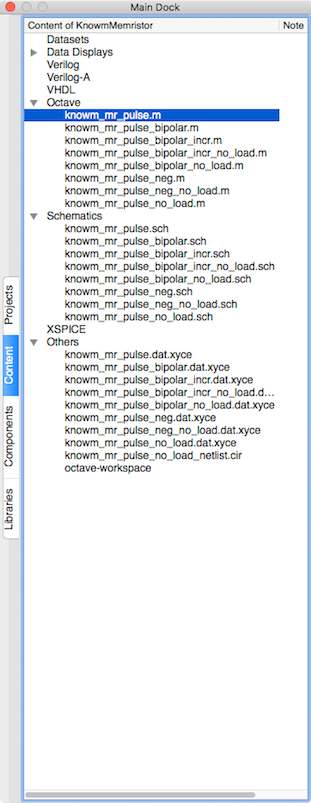
KnowmMemristor_prj Content
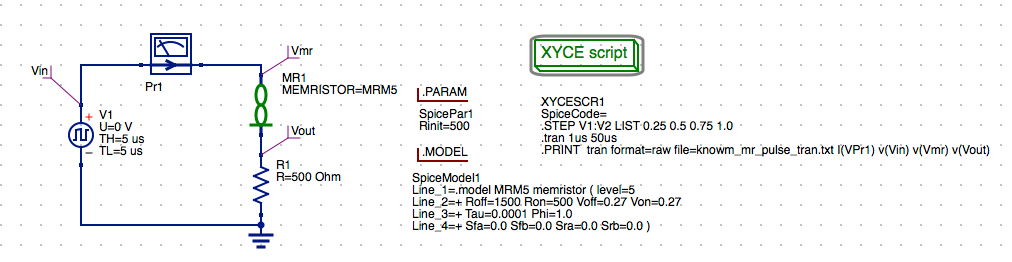
Schematic with 5us Rectangle Pulse
Set the Document Settings
Only one of the two Qucs-S/Octave simulation data post-processing methods can be active at any one time. To select which check the correct boxes in the Edit File Properties window located under File / Document Settings. For example when box open data display after simulation is ticked and box run script after simulation is NOT ticked then the Manual method is selected. Reversing which box is ticked results in selection of the Automatic method of Octave post-simulation data processing.
- Right click on the schematic and select
Document Settings... -
Select
Simulationtab. -
Uncheck
open data display after simulationcheckbox in the dialog. -
Check the
run script after simulationcheckbox in the dialog.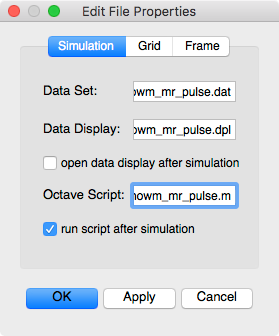
Document Settings for Running Octave Script
-
Click
Applyto save the changes. -
Click
OKto exit the properties dialog.
Save the Schematic Diagram File
-
The filename
knowm_mr_pulse.schhas been used for this example schematic and will be used in future tutorials. -
Click the
Savebutton on the toolbar to save the schematic file.
Save Toolbar Button
Open the Octave Window
The Octave interpreter can be run in Qucs-S GUI mode, as a console, or invoked as part of a shell script.
- Select
View / Octave Windowfrom the Main Menu.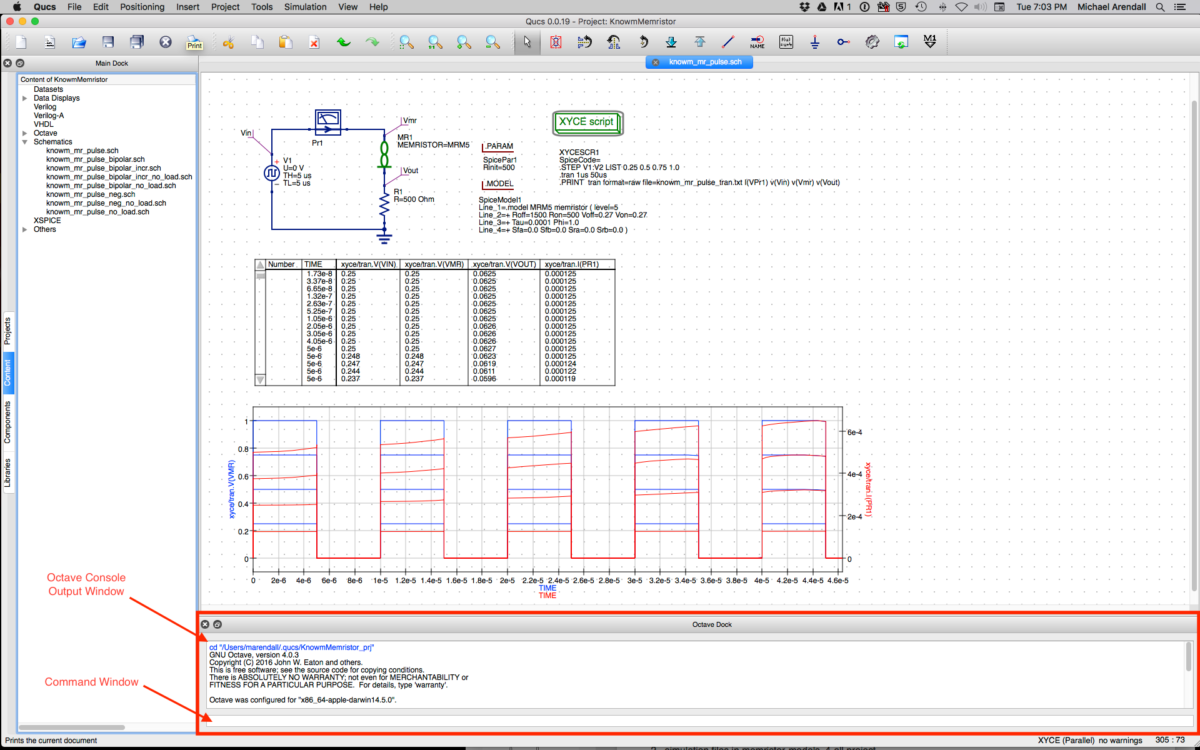
Qucs-S Octave Window
Run a Simulation
-
Press
F2or selectSimulatebutton on the toolbar.Run Simulation Toolbar Button
-
Check simulation for
errorsorwarnings. See the status bar at the bottom of the Qucs windowlower right corner. -
The raw data file
knowm_mr_pulse.dat.xyceproduced by the transient simulation will be automatically created in the$HOME/.qucs/KnowmMemristor_prj/directory and will also be listed in the Content tab under theOtherslist in the project tree.
View the Octave Window Output
The Octave interpreter should now be configured to automatically execute the knowm_mr_pulse.m script, and the ouput will be written to the Octave console output window.
- The Octave console window should display the output of the script. You should observe the text
parsing data . .. ... -
Once the data is parsed the debug output will be displayed in the
Octave console.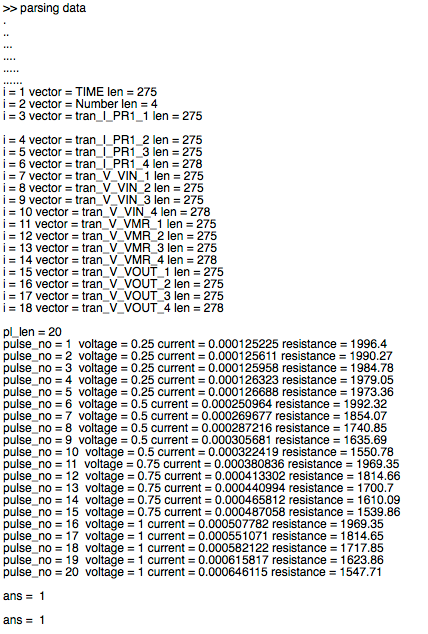
Octave Console Output
-
Next (2) plot windows should be created by the
Qtplot subsystem.NOTE: These plot windows may not be visible due to the fact that the Qucs-S interface may regain focus. You can switch the window focus to the
octave-guiprocess by using the key sequence Command ⌘-Tab. -
The first plot is the Memristor Current vs. the Pulse number.
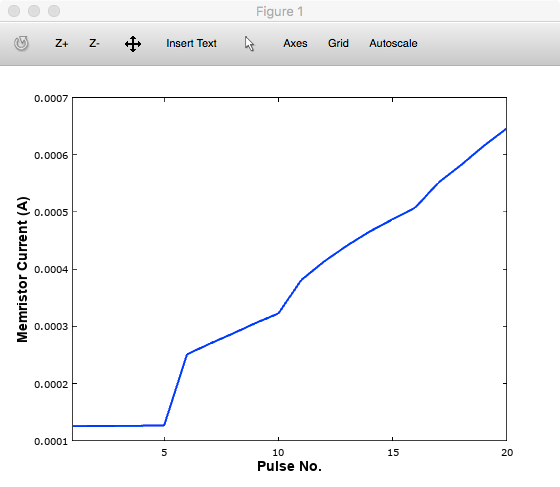
Fig1. Current vs. Pulse No.
-
The second plot is the Memristor Resistance vs. the Pulse number.
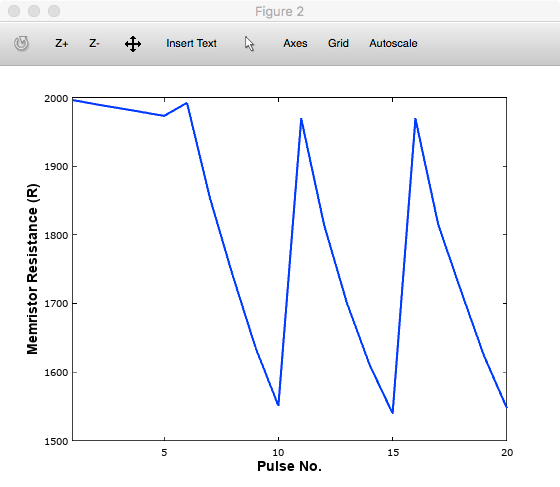
Fig.2 Resistance vs. Pulse No.
Deep Dive: Writing Octave Scripts for Post-Analysis
Octave simulation data post-processing scripts are required to undertake a number of basic tasks if they are to successfully extract useful data from simulation performance results: firstly they must be able to read the numerical output data generated by Qucs-S and convert this information into a numerical format which Octave can read and process, secondly they must instruct Octave as to the data processing tasks that it is required to undertake and thirdly they must be able to tabulate, and/or plot the transformed data in a format that can be easily understood by Qucs-S users. How this is done forms the central topic of the next part of this tutorial.
Applying Octave for this purpose is very worth while but does however, require users to be proficient with MATLAB/Octave numerical analysis and programming. The following shows a copy of the Octave post-process output data processing script knowm_mr_pulse.m introduced in the previous section. The Qucs-S Main Dock window displays the .m files under the Octave list of the project tree.
-
knowm_mr_pulse.m Octave Script
NOTE: Copies of specific Octave functions written to process script xxxxxx.m are also stored in the current Qucs-S project directory, alongside xxxxxxx.sch schematic files. The Quc-S Octave utility scripts are installed in the Qucs-S application directory under the /usr/share/qucs/octave sub-directory. You can reference the source for these scripts while working through the following sections.
Octave post-simulation output data processing scripts
knowm_mr_pulse.m-
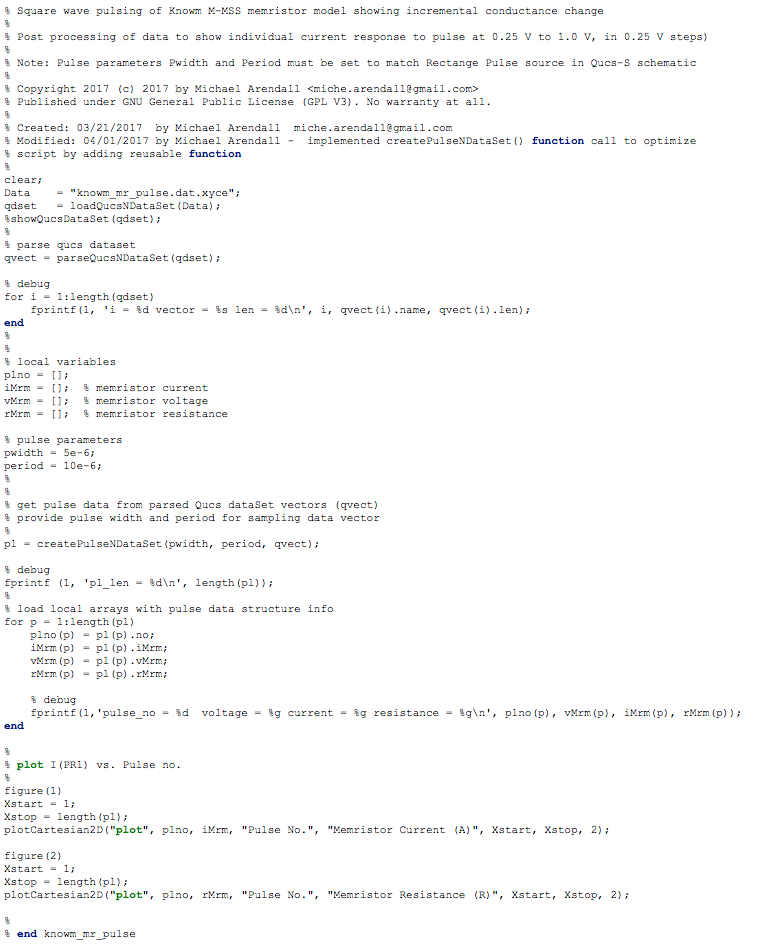
knowm_mr_pulse.m Octave Code
Qucs-S Octave scripts consist of a series of sections which are actioned as a sequence of sequential stages, typically these consist of four functional areas
Section 1
This section is at the start of a xxxxxx.m script. In most instances it consists of a group of comment statements which outline script specification and its use.
-
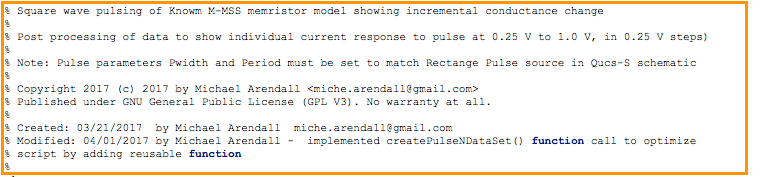
Octave Code Section 1
Section 2
Section 2 consists of a series of statements which define the name of the Qucs-S simulation output data file, knowm_mr_pulse.dat.xyce and the name of the Octave variable qdset that stores the Octave version of Qucs-S Data converted by our extended function loadQucsNDataSet() derived from the standard loadQucsDataSet() supplied with Qucs-S. Normally names, types and sizes of individual Octave variables held by qdset are displayed in the Octave Dock output window by calling the Qucs-S Octave function ShowQucsDataSet(qdset). In this example we have the function call commented out % is the comment line. We instead use the for loop in this section to display the values after our parser has filled the structure qvect which contains addtional information.
-
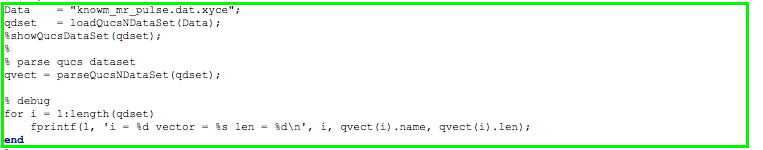
Octave Code Section 2
Section 3
Normally Section 3 is primarily made up of a series of Octave statements which extract individual Qucs-S output quantities from qdset. In the previous Section 2 our Octave function parseQucsNDataSet() recursively calls the Qucs-S built-in Octave function getQucsVariable() which is normally used for this purpose but in our case we instead call a new function createPulseNDataSet() to simplify our code and promote code reuse. This function takes the parameters pwidth and period to determine the sampling time to enable extracting the current, voltage and resistance from the top of our simulated square wave pulse data stored in the structure qvect. In many instances Section 3 would also include additional Octave statements for calculating values characterizing the properties of the circuit/model being simulated. The full power of the Octave matrix based numerical analysis programming language and its optional Tool Boxes are available for this purpose.
-
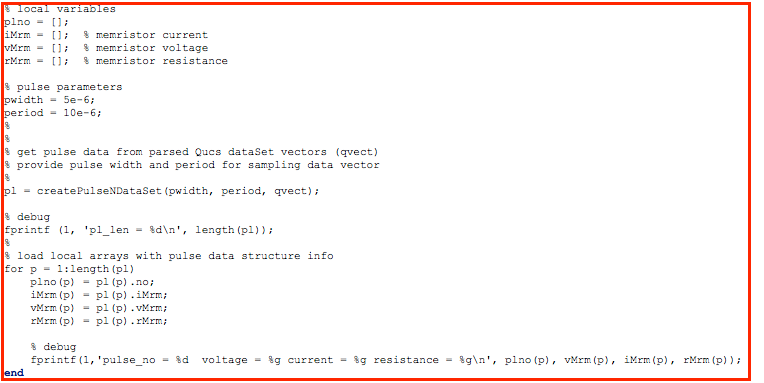
Octave Code Section 3
Section 4
Section 4, the last section in the xxxxxx.m script is normally reserved for Octave code which outputs the calculated results from Section 3. In the majority of cases this output takes the form of plotted graphs, tabulated data or files. The exact form of the generated output data is entirely under the control of individual users and its form will largely depend a users Octave programming skills.
-
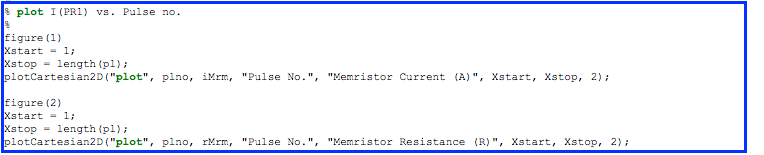
Octave Code Section 4
That completes this tutorial. Try some of the other example schematic files available in the KnowmMemristor_prj project. All of these experiments use common features presented here.
You should also checkout the documentation and other examples listed in the Qucs 0.0.19 and Qucs-S 0.0.19 documentation available on the web at the following URLs.
- Qucs 0.0.19 Help: https://qucs-help.readthedocs.io/en/0.0.19/subcircuit.html
- Qucs-S 0.0.19 Help: https://qucs-help.readthedocs.io/en/spice4qucs/SPICEComp.html
- Qucs-S Bugtracker: https://github.com/ra3xdh/qucs/issues
- Qucs-S Sub-project Home Webpage: https://ra3xdh.github.io/
Other References
- What is Qucs?
- What can all be installed from Sourceforge?
- Qucs Website: http://qucs.sourceforge.net/
- Main Repository: https://sourceforge,net/p/qucs/git/ci/master/tree/
- Mirror Repository: https://github.com/Qucs/qucs
- Mailing lists: http://sourceforge.net/p/qucs/mailman/
- Forum: http://sourceforge.net/p/qucs/discussion/
- Bug trackers:
- Source code documentation:
- The Generalized Metastable Switch Memristor Model
- Simulating the Knowm M-MSS Memristor Model Pulse Response with Qucs-S and Xyce
- Simulating the Knowm M-MSS Memristor Model Using Qucs-S with Xyce
- The Problem is Not HP’s Memristor–It’s How They Want To Use It
- Build Xyce from Source for ADMS Verilog-A Model Integration
- The Pershin Voltage Threshold Memristor Model in NGSpice
- memristor-models-4-all Project on Github


Subscribe To Our Newsletter
Join our low volume mailing list to receive the latest news and updates from our team.